Download
1 / 30
300 likes | 451 Views
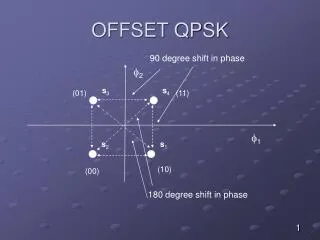
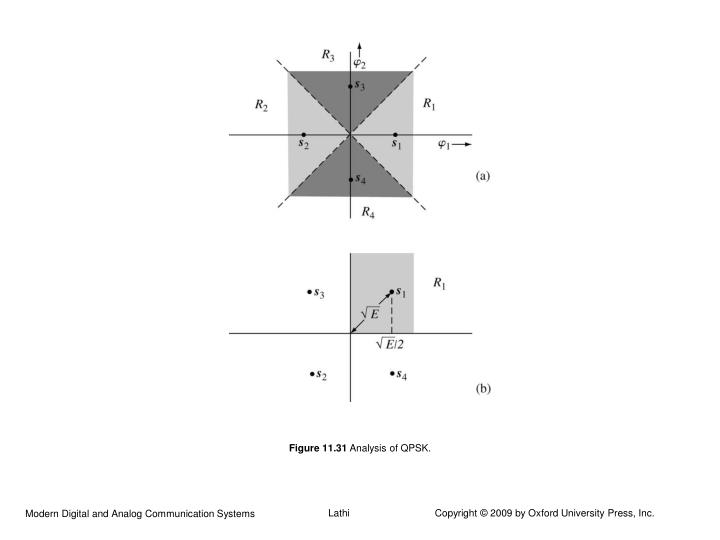
Figure 11.31 Analysis of QPSK. Figure 11.32 Equivalent signal sets. Figure 11.33 Simplex signals. Figure 11.34 Optimum M -ary receiver for nonwhite channel noise. Figure 11.35 Explanation of minimax concept. Figure 11.36 Noncoherent detection of digital modulated signals for ASK.

E N D
Figure 11.34 Optimum M-ary receiver for nonwhite channel noise.
Figure 11.36 Noncoherent detection of digital modulated signals for ASK.
Figure 11.37 Conditional PDFs in the noncoherent detection of ASK signals.
Figure 11.38 Error probability of noncoherent ASK detection.
Figure 11.42 Error probability of PSK, DPSK, and coherent and noncoherent FSK.
Figure 11.43 Snapshot of the modulated signals from three difference pulse shapes: (a) root-raised cosine pulses, of roll off factor=0.5; (b) rectangular pulse; (c) half-sine pulse pulse.
Figure 11.44 BER of optimum (matched filter) detection of polar signaling using three difference pulse shapes: (a) root-raised cosine pulse of roll-off factor 0.5; (b) rectangular pulse; (c) half-sine pulse.
Figure 11.45 Power spectral density of the binary polar transmission using three difference pulse shapes: (a) root-raised cosine pulse of roll-off factor 0.5; (b) rectangular NRZ pulse; (c) half-sine pulse pulse.
Figure 11.46 Waveforms of the two pulses used in orthogonal binary signaling: solid curver, half-sine pulse; curve with circles, sine pulse.
Figure 11.47 Measured BER results in comparison with analytical BER.
Figure 11.48 Eye diagram of the real (in-phase) component of the 16-QAM transmission at the receiver matched filter output.
Figure 11.49 Symbol error probability of 16-QAM using root-raised cosine pulse in comparison with the analytical result.
Figure 11.50 Scatter plot of the matched filter output for the 16-QAM signaling with root-raised cosine pulse when Eb/N = 18 dB.
Figure 11.52 Analytical BER results from noncoherent detection of binary DPSK simulation (round points).