Download
1 / 65
650 likes | 754 Views
THE POPULATIONS & CHEMICAL ENRICHMENT OF w CENTAURI. JOHN E. NORRIS RESEARCH SCHOOOL OF ASTRONOMY & ASTROPHYSICS MOUNT STROMLO & SIDING SPRING OBSERVATORIES AUSTRALIAN NATIONAL UNIVERSITY. PLAN OF ATTACK. Historical review (pre ~1995) Chemical abundances on the Red Giant Branch

E N D
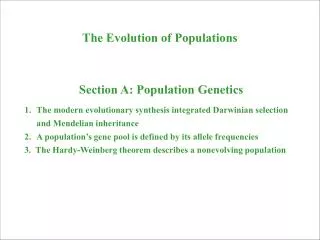
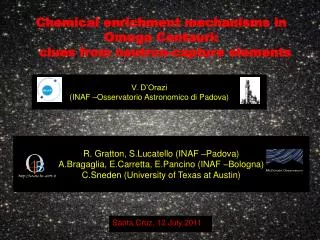
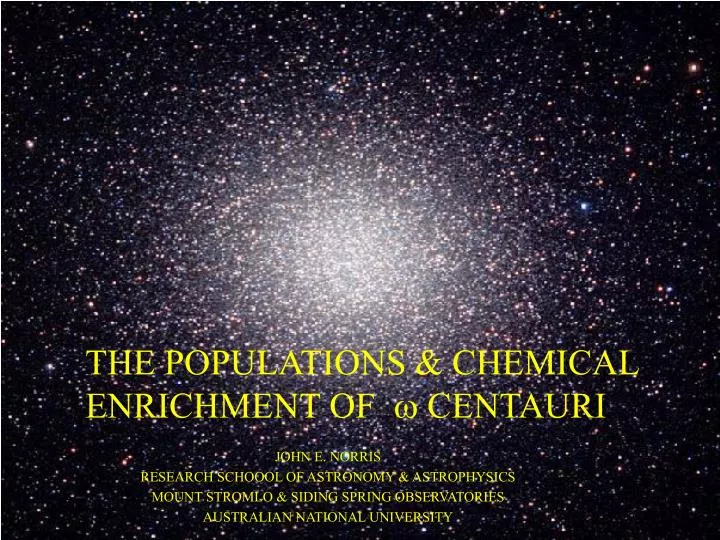
THE POPULATIONS & CHEMICAL ENRICHMENT OF w CENTAURI JOHN E. NORRIS RESEARCH SCHOOOL OF ASTRONOMY & ASTROPHYSICS MOUNT STROMLO & SIDING SPRING OBSERVATORIES AUSTRALIAN NATIONAL UNIVERSITY
PLAN OF ATTACK • Historical review (pre ~1995) • Chemical abundances on the Red Giant Branch • Metallicity Distribution Function & relative abundances • constraints on enriching stars and age spread • Kinematics vs. abundance • Constraints on formation mechanisms • Populations • Main sequence studies • Constraints on the population parameters Collaborators:M.S.Bessell, K.Bekki, R.D.Cannon, G.S.Da Costa, K.C.Freeman, M.Mayor, K.Mighell, G.Paltoglou, P.Seitzer, L.Stanford
Abundance inhomogeneity of w Cen (1960-1995) • Discovery of CH star • Harding (1962) • Wide giant branch • Woolley et al (1966, photographic), Cannon & Stobie (1972, photoelectric) Cannon & Stobie 1972, MNRAS, 162, 207 Lee 1977, A&AS, 27, 381 w Cen 47 Tuc
Discovery of CH star Harding (1962) Wide giant branch Woolley et al (1966, photographic), Cannon & Stobie (1972, photoelectric) [Ca/H] spread among RR Lyrae stars Freeman & Rodgers (1975, low res) Large CN variations among red giants Norris & Bessell (1975, low res), Dickens & Bell (1976, low res) Large CO spread among red giants Persson et al (1980, IR photometry) Abundance inhomogeneity of w Cen (1960-1995) [Ca/H] = log(N(Ca)/N(H))* -log(N(Ca)/N(H))o
C and/or O enhance- ment unique to w Cen Persson et al 1980, ApJ, 235, 452
Discovery of CH star Harding (1962) Wide giant branch Woolley et al (1966, photographic), Cannon & Stobie (1972, photoelectric) [Ca/H] spread among RR Lyrae stars Freeman & Rodgers (1975, low res) Large CN variations among red giants Norris & Bessell (1975, low res), Dickens & Bell (1976, low res) Large CO spread among red giants Persson et al (1980, IR photometry) Heavy element abundance spreads High resolution spectroscopy Cohen (1981; 5 stars), Gratton (1982; 8), Francois et al (1988; 6), Paltoglou & Norrris (1989; 15), Brown & Wallerstein (1993; 6), Norris & Da Costa (1995; 35), Smith et al (1995; 7) Abundance inhomogeneity of w Cen (1960-1995)
Norris, Freeman & Mighell1996, ApJ, 462, 241 METALLICITY DISTRIBUTION FUNCTION Ca II H&K AAT [Ca/H] abundance histograms Ca II triplet 74-inch [Ca/H] = log(N(Ca)/N(H))* -log(N(Ca)/N(H))o Ca II triplet 74-inch (R ~ 4000) NB: Complete sample of red giants having V < 13
Norris, Freeman & Mighell1996, ApJ, 462, 241 Two populations Simple model, closed box approximation: First population: [Ca/H]0 = -1.59 <[Ca/H]> = -1.29 Second population: [Ca/H]0 = -1.09 <[Ca/H]> = -0.83 metal-rich/metal-poor ~ 0.20
[alpha/Fe] vs. [Fe/H] (NB: heavily biased sample) w Cen Other clusters Norris & Da Costa 1995, ApJ, 447, 680 (AAT UCLES R ~ 35000) Enrichment by SNe II
Norris & Da Costa 1995, ApJ, 447, 680 w Cen Other clusters [neutron capture/Fe] vs. [Fe/H] Enrichment by (intermediate- mass) AGB stars
Norris, Freeman & Mighell, 1996 ApJ, 462, 241 Heavily biased sample (AAT UCLES high-res) No counterpart elsewhere in Galaxy. Suggests causal link between populations Normal globular clusters Unbiased sample (AAT, 74-inch low-res)
Smith et al 2000, AJ, 119, 1239 0.0 5Mo [Rb/Zr] 3Mo Star formation occurred over 2-3 Gyr 1.5Mo 1.0 5Mo 0.0 3Mo 1.5Mo [Rb/Zr] 1.0 0.0 5Mo [Rb/Zr] 3Mo 1.0 1.5Mo -2.0 -1.5 -1.0 [Fe/H]
Norris, Freeman & Mighell 1996, ApJ, 462, 241 [Ca/Fe] vs. radius Abundance decreases with radial distance
Norris, Freeman, Mayor & Seitzer 1997, ApJ, 487, L187 Rotation vs. abundance Metal-poor sample: DV = 10.7 +/- 1.8 km/s Metal-rich sample: DV = 3.0 +/- 2.4 km/s Metal-poor population rotating more rapidly
Norris, Freeman, Mayor & Seitzer 1997, ApJ, 487, L187 Kinematics vs. abundance Metal-poor sample kinematically hotter and rotating more rapidly. O Not ELS type collapse O Kinematically consistent with binary cluster evolution (e.g. Makino et al 1991 Ap&SS, 185, 63); but not clear this works chemically
Pancino et al 2000, ApJ, 584, L83 Ferraro et al 2004, ApJ, 603, L81 (see also Lee et al 1999, Nature, 402, 55) ‘Third’ population
Pancino et al 2002, ApJ, 568, L101 [Ca/Fe] Enrichment by SNe Ia [Fe/H]
To w Cen’s main sequence withAAT Two Degree Field Spectrographs
… working with Laura Stanford, Gary Da Costa & Russell Cannon(Stanford et al 2006, ApJ, 647,1075) 2002 1998/99
Stanford et al.(2006, ApJ, 647, 1075) From - • Ages of individual star in the CMD determined from YY isochrones, taking into account correlated age-metallicity errors • Comparisons of Monte-Carlo CMD simulations with that of the cluster There exists an age-metallicity relation, with the more metal-rich populations being younger by 2-4 Gyr than the metal poor one
Stanford et al. 2006, ApJ, 647, 1075 Age ranges from the literature
Stanford et al. 2006, ApJ, submitted [Sr/Fe] = +1.6 [Ba/Fe] < +0.8:
Bedin et al. 2004, ApJ, 605, L125 (also Anderson 1997, 2000, 2003 Thesis UBerkeley & ASP Proceedings) HST data Anderson’s double main sequence
Norris, Freeman & Mighell1996, ApJ, 462, 241 Two populations Simple model, closed box approximation: First population: [Ca/H]0 = -1.59 <[Ca/H]> = -1.29 Second population: [Ca/H]0 = -1.09 <[Ca/H]> = -0.83 metal-rich/metal-poor ~ 0.20
Majority, metal-poor population should be bluest! Bedin et al. suggest: • Observations and/or modelling wrong • Bluer main sequence has [Fe/H] < -2.0 • Bluer main sequence has higher helium (Y > 0.3) • Two clusters superimposed, separated by 1-2 kpc along line of sight Note: X = hydrogen mass fraction Y = helium mass fraction Z = heavy element mass fraction
Norris 2004, ApJ 612, L25 Revised Yale Isochrones Pop 1st 2nd 3rd [Fe/H] -1.7 -1.2 -0.6 Y 0.23 0.23 0.23 Age(Gyr) 16 16 16 Fraction 0.80 0.15 0.05
Norris 2004, ApJ, 612, L25 Revised Yale Isochrones Pop 1st 2nd 3rd [Fe/H] -1.7 -1.2 -0.6 Y 0.23 0.23 0.23 Age(Gyr) 16 14 12 Fraction 0.80 0.15 0.05
Norris 2004 ApJ, 612, L25 Revised Yale Isochrones Pop 1st 2nd 3rd [Fe/H] -1.7 -1.2 -0.6 Y 0.23 0.35 0.38 Age(Gyr) 16 15 14 Fraction 0.80 0.15 0.05
Bedin et al. 2004, ApJ, 605, L125 (astro-ph/0403112) (also Anderson 1997, 2000, 2003 Thesis UBerkeley & ASP Proceedings) HST data Anderson’s double main sequence
VLT Giraffe Piotto et al. 2005, ApJ, 621, 777 The blue main sequence is more metal-rich by 0.3 dex! D[C/Fe] = 0.0; [N/Fe]bMS = 1.0-1.5, [N/Fe]rMS < 1.0
Sollima et al 2006, astro-ph/0609650 10’<r<15’ r >15’ NbMS/NrMS = 0.16 NbMS/NrMS = 0.17 r < 10’ NbMS/NrMS = 0.24 The ratio of bMS to rMS is a function of cluster radial distance
Norris, Freeman & Mighell 1996, ApJ, 462, 241 [Ca/Fe] vs. radius Abundance decreases with radial distance
BUT … • Canonically, DY/DZ ~3-4, and with an increase from [Fe/H] = -1.7 to -1.2 one expects only DY = 0.003! • Suggests non-canonical evolution. OBSERVATIONALLY … • Determine Y from hot blue HB stars? • Use sensitivity of HB luminosity &Teff to Y? (Yup => Teffup,L up) • Zero-Age HB RR Lyraes of 2nd pop should be brighter by 0.2-0.3mag. In contrast, the observed metal-richer RR Lyraes are fainter by 0.2-0.3mag! (see also Sollima et al. 2006, ApJ, 640, L43) But … are the variables representative of the populations?
Ferraro et al 2004 ApJ, 603, L81 RR Lyrae Rey et al 2004 D’Cruz et al 2000 ApJ, 530, 352 - HST UV observations Pop 1st 2nd Alt.2nd [Fe/H] -1.7 -1.2 -1.2 Y 0.23 0.35 0.23 Age(Gyr) 14 12 12 Fraction 0.80 0.15 0.15 Turnoff mass (Msun) 0.82 0.71 0.85 “… over 30% of the HB objects are “extreme” HB or post-HB stars” see also: Lee et al., 2005, ApJ, 621, L57
Lee at al. 2005 ApJ, 621, L57 Helium constant Y Z [Fe/H] Age 0.231 0.0006 -1.45 13 0.232 0.001 -1.23 13 0.38 0.0015 -1.05 12 0.40 0.0028 -0.78 11.5 0.42 0.006 -0.45 11.5 Helium varies
CANDIDATES FOR PRODUCERS OF HELIUM • Massive stars (~60 Mo) with rotationally driven mass loss (Maeder & Meynet 2006, A&A, 448, L37) - also produce copius N, but not large overabundances of C and O • 10-14 Mo SNe (Piotto et al 2005, ApJ, 621, 777) • More massive (~6-7 Mo) AGB stars • Helium diffusion in protocluster phase (Chuzhoy 2006, MNRAS, 369, L52) “Element diffusion can produce large fluctuations in the initial helium abundance of the star-forming clouds. Diffusion time-scale … can fall below108 years in the neutral gas clouds dominated by collisionless dark matter or with dynamically important radiation or magnetic pressure. ” • Problems with self enrichment by above (stellar) candidates within a closed system producing so much helium. Bekki & Norris (2006, ApJ, 637, L109) suggested second population formed from gas “ejected from field stellar populations that surrounded w Cen when it was the nucleus of an ancient dwarf galaxy”
Bekki & Norris 2006, ApJ, 637, L109 Y Helium production in stars (D’Antona et al (2005) suggest AGB stars with 6<M/Mo<7 can produce Y = 0.40) Log (Stellar mass) f2nd/(f1st+f2nd) Constraints on two populations, in which the AGB ejecta of the first (IMF slope s1) forms the second (s2). Massive star ejecta lost from the system, but all AGB ejecta for 6<M/Mo< 7 are retained and form second population. (f is fraction of stars with M< 0.88Mo) s1=2.35 frem (remnant mass fraction of GC)
Bekki, Campbell, Lattanzio & Norris 2006, MNRAS, submitted Globular cluster formation in the central regions of low-mass protogalaxies embedded in dark matter halos. First population forms at the center of the potential well. All AGB ejecta from first generation is retained in the potential well. Infalling protogalactic gas combines with the retained AGB material to form the second generation. Free parameters: s (=MIN/MAGB); timescale for (exponential) infall of protogalactic gas (~106 yr) with star formation ceasing after 107 yr; initial gas mass (Mg(0)) when infall begins. omega Cen model with very small s (i.e. higher degree of AGB material), smaller infall time (i.e. rapid infall) and smaller initial gas mass (i.e. more rapid chemical enrichment)
SUMMARY • w Cen possesses at least three distinct populations, described to first approximation by: Population First Second Third Fraction 0.80 0.15 0.05 [Fe/H] -1.7 -1.2 -0.6 Y 0.23 0.35 0.38: YY Age (Gyr) 14 12 12: s(Vr) (km/s) 13 8 13 Rotation (km/s) 11 3 unknown • The origin of the helium in the second population is currently not well understood. • System not formed in an ELS scenario, but more likely as a dwarf galaxy having multiple star-formation episodes well away from the forming Galaxy, and later being captured by it.
THE CHEMICAL ENRICHMENT OF w CENTAURI JOHN E. NORRIS RESEARCH SCHOOOL OF ASTRONOMY & ASTROPHYSICS MOUNT STROMLO & SIDING SPRING OBSERVATORIES AUSTRALIAN NATIONAL UNIVERSITY
Norris, Freeman & Mighell1996, ApJ, 462, 241 Low resolution (R~4000) [Ca/H] from Ca II H&K and Ca II infrared triplet ROA 253 Ca II H&K Ca II infrared triplet ROA 253
High resolution spectrum obtained with AAT UCL Echelle Spectrograph (UCLES)
High resolution spectra of 35 red giants (AAT UCLES, R~35,000; ~1993)
w Cen Lee et al 1999, Nature, 402, 55
Stanford thesis Stars observed in 2002 box • Cen radial-velocity members in 2002 box
Metallicity Distribution Function Stanford et al (2006, ApJ, 647, 1075)