Download
1 / 16
250 likes | 487 Views
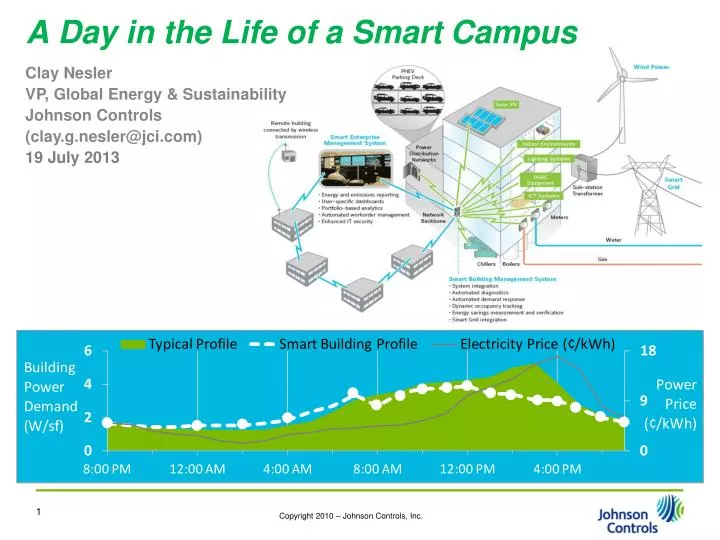
A Day in the Life of a Smart Campus. Clay Nesler VP, Global Energy & Sustainability Johnson Controls (clay.g.nesler@jci.com) 19 July 2013. 8:00 pm Smart planning for tomorrow System accesses tomorrow’s weather forecast Real time price forecasts are received from the electric utility

E N D
A Day in the Life of a Smart Campus Clay Nesler VP, Global Energy & Sustainability Johnson Controls (clay.g.nesler@jci.com) 19 July 2013
8:00 pm • Smart planning for tomorrow • System accesses tomorrow’s weather forecast • Real time price forecasts are received from the electric utility • System schedules night time ice storage generation 93°F 94°F 97°F 98°F 98°F 98°F 98°F 98°F
12:00 am • Smart charging of EV fleet • Optimized off-peak charging of electric fleet vehicles • System accesses real-time grid status and wind energy forecasts • Charging is timed to coincide with excess renewable energy supply on the grid
2:00 am • Pre-cool building mass • At the optimal time, the building mass is pre-cooled to the lower end of the comfort zone • Throughout the day, the room set points are adjusted to “release” the storage energy
4:00 am • Chiller fault detected • On-board diagnostics determines a chiller valve has failed • System calculates costs associated with this fault based on real time price forecasts • System auto-generates a work order and notifies facility manager by smart phone
7:00 am • Chiller repaired • Service technician arrives after being dispatched automatically • Technician quickly fixes problem knowing the source and the new parts required • Repair allows system to generate enough ice prior to spike in prices anticipated later in the afternoon
8:00 am • Faculty and staff plug in vehicles • Electric or plug-in hybrid vehicles recharge when real time price of electricity is low • Smart charging supports voltage regulation for the local utility • Purchase or sale of power to building is automatically factored into payroll system
9:00 am • Meeting space is ready to go • The building management system prepares the conference room for a meeting with 15 people • Occupancy and CO2 sensors provide an override in the case less or more people attend the meeting
11:00 am • Utility power price triggers automatic demand reduction • The price for electricity from 12pm-2pm exceeds the threshold pre-defined by the university • The following actions to reduce power demand are taken: • reset space temps by 2°F • slowly dim lighting 20% in occupant spaces • dispatch ice storage cooling • Actions and impact reported back to utility
1:00 pm • Lighting and blinds adjust to ambient conditions • Automated lighting system reduces indoor lighting energy when there is sufficient natural day light available • Automated blinds track sun position and adjust to maximize natural lighting and reduce glare
2:00 pm • Automated demand reductions leverage IT system integration • System alerts students and staff via email or text message to unplug their laptops and run on battery power from 2-4pm • PC power management software agent automatically reduces desktop power consumption • Computing load is reduced for non-production servers and non-critical tasks are deferred
3:00 pm • Cloud cover causes solar photovoltaic generation to drop • Building receives a demand limiting signal from utility during the 2pm -5pm period. • When cloud cover causes solar production to drop, system uses on-site electric storage to meet demand reduction goal • Combination of distributed generation, electric and thermal storage and vehicle charging is used to control the load profile
4:00 pm • Facility Director checks savings from energy efficiency projects • System develops statistical model of building energy performance based on weather and occupancy • Energy savings from retrofit projects and operational improvements are tracked daily on a “negawatt meter” and over time
5:00 pm • Leaving the office • As faculty and administration badges out, the system automatically turns off the lights and puts their computer into stand-by • When he arrives to parking deck, his plug-in electric vehicle has been charged just enough for him to get home
8:00 pm • Leaving on vacation • Facility Director makes one last check of building status around the campus before leaving for vacation • While gone, all alarms and alerts are automatically routed to alternative contacts • The Facility Director can log in to the system remotely from any internet enabled device, but won’t…
More information about smart buildings and energy systems is available at: www.InstituteBE.com