Download
1 / 10
100 likes | 277 Views
Excel and Regression. On the next screen you can see I typed in the data for an schooling / income study. I even put in labels in the first row.

E N D
On the next screen you can see I typed in the data for an schooling / income study. I even put in labels in the first row.
On the main menu at the top, go to the tools option. When you click on tools you want to see the tool called data analysis. Excel does not always show this option. If you do not see data analysis, hit the Add-Ins option. From the pop-up menu there check the Analysis Toolpak. When this is completed you should be able to go back to tools on the menu at the top and hit data analysis. You would then see a screen similar to what comes next in these slides. You will have to scroll down in the list to get to “regression.”
On the next screen you will see what excel asks you to put in to get the regression results.
For the example I had on slide 4, For the Input y range put b1:b6, the cells the data is in. (y is the dependent variable – the variable I am most interested in understanding.) For the Input x range put a1:a6. (x is the variable we think will help us predict and explain y.) Check labels box. (Only check the labels box if you have a label in the data set like I do.) Check confidence level box - keep at 95% Check output range and a9 in open box. (I like to have the output next to the data set. You can go to a new worksheet if you want.)
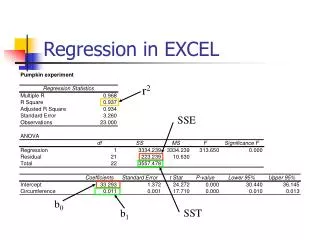
When you say ok to the regression dialog box Excel will do its thing and have the results highlighted. Keep the results highlighted, but you will need to adjust the column widths to be able to read the output. Open the Format menu, choose ‘column’ and select ‘autofit selection.’ Then un-highlight the cells and look at your results. If you print the results you may want to change the page to landscape. Sometimes in the output you will see a number followed by E and some other stuff. E-06 means take the number given and move the decimal place six places to the left. Similarly, E+06 means move the decimal 6 places to the right.