Download
1 / 53
530 likes | 644 Views
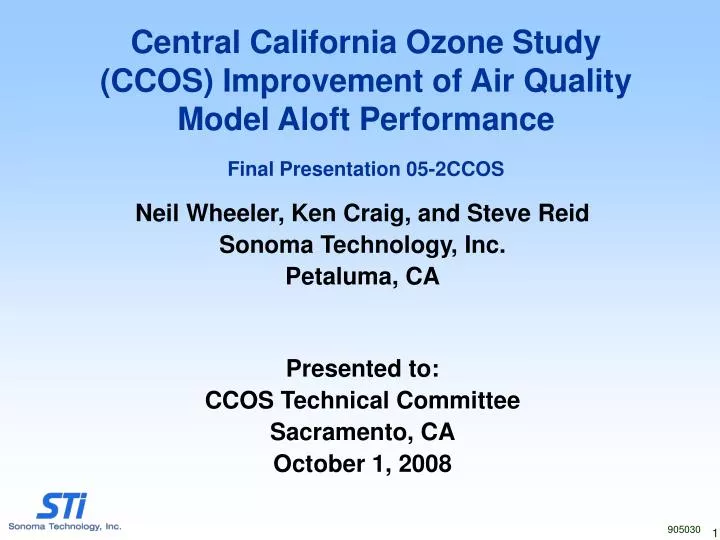
Central California Ozone Study (CCOS) Improvement of Air Quality Model Aloft Performance Final Presentation 05-2CCOS. Neil Wheeler, Ken Craig, and Steve Reid Sonoma Technology, Inc. Petaluma, CA Presented to: CCOS Technical Committee Sacramento, CA October 1, 2008. 905030. Overview.

E N D
Central California Ozone Study (CCOS) Improvement of Air Quality Model Aloft Performance Final Presentation 05-2CCOS Neil Wheeler, Ken Craig, and Steve Reid Sonoma Technology, Inc. Petaluma, CA Presented to: CCOS Technical Committee Sacramento, CA October 1, 2008 905030
Overview • Introduction • Analyses • Summary and Conclusions • Recommendations
Background • Progress towards attaining the NAAQS • Model Performance Issues • Episodes • July 8-15, 1999 – Limited data aloft • July 29 - August 2, 2000 – High ozone aloft • September 16-21, 2000 – Normal ozone aloft • Roles • MM5 Meteorological Modeling – NOAA • Meteorological and Air Quality Modeling - ARB • Air Quality Model Improvement – STI
Performance Hypotheses (1 of 2) • Emission inventories are biased low • Wildfires are not adequately represented • Boundary concentrations are inaccurately specified • Lack of data • Transport from Asia • Transport from Southern California • Tropopause folding events (stratospheric ozone intrusion) • Grid resolution is insufficient • Meteorological models are unable to capture stagnant air conditions caused by terrain blocking of the flow
Performance Hypotheses (2 of 2) • Vertical mixing of pollutants in the planetary boundary layer is overestimated resulting in relatively clean air aloft being mixed downward • Mixing of high ozone surface air to the interior of the convective boundary layer is inadequate. • Recirculation of upslope flow from the Sierra Nevada Mountains and Coastal Range over the Central Valley are inadequately represented. • Chemical mechanisms underestimate ozone production efficiency at low precursor concentrations • Dispersion in areas of significant and steep terrain in central California is treated inadequately. • Photolysis rates at higher elevations are treated inadequately
Improvement Process • Characterization • Evaluation • Identification of model performance issues • Diagnosis of the possible causes • Correction • Reevaluation
Structure of Air Quality Aloft • Aircraft Spirals • Aircraft Traverses • Ozonesondes • Hydrocarbons
Aircraft Spirals 35.9N 19.5W 37.0N 120.1W
Transport Statistics RWP MM5
Vertical Wind Profiles MM5 RWP TC A53
TC A53 0700 PDT August 1 Morning Ozone Predictions
Ozone Correlation by Level 7.5 km 1.8 km 0.25 km 0.9 km
Meteorological Modeling Issues • MM5 • CALMET-MM5 Hybrid • Mapping to CAMx vertical structure • Evaluation of winds above 2-km • Mechanical mixing at night
Improvements • Meteorology (MM5) • Vertical Structure • Nighttime Mixing • Photolysis Rates • Wildfire Emissions • Anthropogenic and Biogenic Emissions • Emphasis on July-August 2000 Episode
Evaluation Process • Aloft Model Performance for Ozone • Hourly Averages for Grid Cells • Scatter Plots • Correlation • Inert Tracer Simulations for Meteorology Changes • Vis5D Animations of Ozone & Inert Tracers • Difference Plots • Ground Level Model Performance
Results • Meteorology (MM5) • Vertical Structure • Nighttime Mixing • Photolysis Rates • Wildfire Emissions (partial) • Emission Inventory Improvements (incomplete)
Meteorology • NOAA’s “Best” Simulation • Not our requested simulation • No hourly average output • Interpolated observation FDDA • Results • Not much change in performance or flow structure • Vertically interpolated observation nudging did not obscure or significantly weaken return flows
Winds Original New
Vertical Structure • CAMx and MM5 layers matched in first 2 km • 38 Layers • Results • Better vertical resolution of winds in CAMx • Little change in net circulation • Transport through boundaries aloft
Ozone Transport Through Boundaries Monday, July 31, 2000 1.3 km 5.0 km
Nighttime Mixing Issues • Surface roughness and friction velocity • Fire emissions • Recirculation
Nighttime Mixing • Mechanical Mixing Model • Neutral and stable: van Ulden and Holtslag (1985) • TKE profiles • Near neutral : Zhang et al. (1996) • Stable: Lenschow et al. (1988)
Alternate Photolysis Rates • Modified CAMx 4.31 to read in terrain elevations and calculate layer heights above mean sea level (MSL) • April 2006 release of TUV 4.01 allows levels to be specified • Pseudo-spherical two-stream delta-Eddington scheme • Increased number of photolysis levels in CAMx from 11 to 27
Spatial Differences – New Photolysis Case photorig: Photolysis rates used in TC simulation Case newphot: Terrain-corrected photolysis rates
Wildfire Emissions • Stack parameters and plume rise • Plume rise: 2 km (intended) vs. > 10 km calculated in CAMx • Default stack parameters: T=295 ˚K and V=4 m/s • Smoldering emissions • Fire effects models • Dominate VOC emissions from fires • Diurnal variations • Post burn smoldering • Issues with establishing defensible profiles
Wild Fire Tracers 16 km
Wild Fire Emissions Research • JFSP Matrix • JFSP FT-CSA • USFS-FERA FCCS • NASA Vertical Analysis • JFSP SEMIP
EI Improvements • Acquired draft improved EI for Emissions Reconciliation Project • Initial review indicated the changes were not large enough, based on past sensitivity studies, to warrant a separate simulation • Emissions Reconciliation Project indicated additional investigation warranted
Modeling Domain • CAMx Simulations • Ozone mass flux analyses • Transported ozone and tracers through southern and western boundaries • SJVAQS 1990 • Animations
September 2000 Episode • MM5 temperature bias • No new MM5 simulations • Biogenic emissions in southern SJV • Underestimation of TNMOC:NOX emission ratios in southern SJV
Maximum Predicted Temperatures September 19, 2000
Summary • Air Quality Aloft • Transport Processes • Production Processes • Fires • Emissions • Meteorological Model Biases • Modeling Domain