Download
1 / 19
220 likes | 381 Views
Derailment Risk Model. Frequency analysis and scenario development. Agenda. 1. Background. 2. Frequency Assessment. 3. Consequence / Impact Assessment. 4. Summary. Risk Model Structure. Traditional bow-tie approach. Hazard = derailment.

E N D
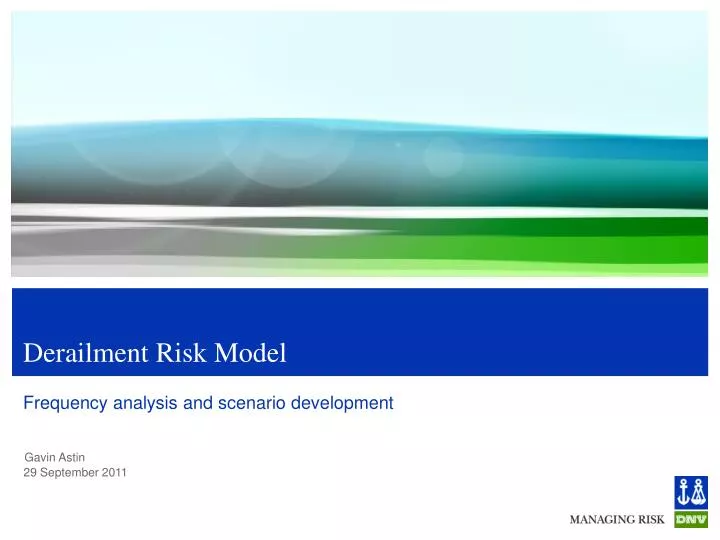
Derailment Risk Model Frequency analysis and scenario development
Agenda 1. Background 2. Frequency Assessment 3. Consequence / Impact Assessment 4. Summary
Risk Model Structure Traditional bow-tie approach. Hazard = derailment. Freight train risk reduction measures shown as controls in the bow-tie structure.
Background to Risk Model Data • Previous freight train derailment accident reports: • 201 accident reports collected by DNV from various sources. • The Agency provided access to accident summaries used for their previous work. After elimination of duplicates, those which were not derailments etc. the usable Agency data was 355 accident summaries from a range of European countries. • The total volume of information used was 556 accident reports / summaries. • Undertook research to establish other freight train derailment causes, not necessarily occurring in the accident data. (Although if not occurring in 500+ accidents then we can conclude that such causes are very low contributors.) • These data populate frequency (“fault tree”) and scenario (event tree) models. • Observations: • Not many accident reports identify root causes. This makes analysis difficult. Hot axle box may have caused a derailment, but what caused the HAB? • Systematic analysis of accident data on an annual basis may identify national differences, good practice and trends (not just limited to freight train derailment accidents).
Agenda 1. Background 2. Frequency Assessment 3. Consequence / Impact Assessment 4. Summary
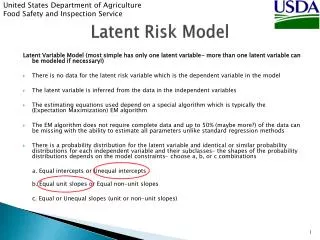
Fault Tree Extract This is part of a set of fault trees, although they were used to quantify the analysis.
Alternative Frequency Analysis Approach Annual number of significant derailments per year = 500 (from Eurostat and Agency data) A severe derailment is one which has the potential for loss of containment. A significant derailment is one which has the potential to become severe.
Some Statistics for Accidents with Single or Dominant Cause • About 75% of derailments have single or dominant cause: • > 65% Inf derailments result from track geometry defects (track width dominant from single causes, although when combinational causes included track twist becomes dominant). • > 70% RS derailments result from wheel / wheel set failures (HAB dominant). • ~ 25% Ops derailments result from loading errors (although dominant single cause is brake checking errors including handbrake left on) • Example: HAB = 75% * 41% * 38% = about 12% (60 in number) of all derailments.
Some Statistics for Accidents with Several Causes Track geometry defects appear in about 50% of accidents where more than one cause is present, with track twist the most significant appearing in about 30%. Wheel profile defects appear in about 20% of accidents where more than one cause is present. Wagon wrongly loaded appears in about 10% of accidents where more than one cause is present. Train mishandling appears in 10% of accidents where more than one cause is present. Our assumption is that removal of a one of these causes will prevent the derailment.
Derailment Frequency Assessment Results Derail numbers.docx
Agenda 1. Background 2. Frequency Assessment 3. Consequence / Impact Assessment 4. Summary
Derailment Event Tree Considerations and Some Data • Factors include: • Derailment location. • Immediate consequences: • Severe (e.g. overturn, mechanical impact causes loss of containment) • Not immediately severe: • Is derailment detected? • Is train brought to a safe stop? • About 70% of low speed derailments occur in or around stations. • About 25% of low speed derailments are immediately severe (potential for loss of containment). • About 30% of high speed derailments occur in or around stations. • About 50% of high speed derailments are immediately severe.
Partial Event Tree (preceding branches are speed & location)
Derailment Event Tree Statistics • Each outcome has an impact in terms of: • Potential loss of life. • Operational disruption. • Track damage. • Wagon damage. • Environmental events (contamination). • We estimate: • About 4 fatalities per year (almost exclusively from DG incidents). • About 17,000 hours operational disruption per year. • About 720 km track damage per year. • About 2,400 damaged wagons per year. • About 65 contamination events per year.
Agenda 1. Background 2. Frequency Assessment 3. Consequence / Impact Assessment 4. Summary
Summing Up • Risk model predicts impacts. • Benefits of identified measures are determined in terms of avoided derailments / reduced impacts. • Potential costs of new measures are defined by the application scope, measure cost and maintenance parameters and effectiveness of each measure
Safeguarding life, property and the environment www.dnv.com