Download
1 / 38
380 likes | 492 Views
PCI Risk Model Comparisons. An alternative model for case level estimation of pre-procedure PCI Mortality Risk Michael Blechner, M.D. Michael Matheny, M.D. Goal.

E N D
PCI Risk Model Comparisons An alternative model for case level estimation of pre-procedure PCI Mortality Risk Michael Blechner, M.D. Michael Matheny, M.D.
Goal • Explore alternative models for pre-intervention risk assessment in patients being considered for a percutaneous coronary intervention (PCI)
PCI Background • A myocardial infarction is typically due to a chronic narrowing in one or more of the blood vessels supplying the heart combined with an acute obstruction at that site • Treatment options • surgical bypass of the region or • PCI in which a catheter is fed through the vessel and the temporary inflation of a small balloon widens the vessel lumen • Both techniques can also be performed on patients with evidence of chronic narrowing but who have not yet had an MI
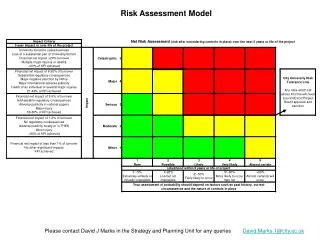
Pre-intervention Risk Assessment • Risk of death in PCI varies widely based on co-morbidities • Providing case level estimations can greatly aid patient and physician decision-making • Estimates by physician experts are inaccurate at the high and low ends of the probability spectrum
History of PCI Risk Assessment • PCI is a high volume procedure with significant morbidity & mortality • Early attempts to develop statistical models of risk were limited by non-standardized data • The American College of Cardiologists (ACC) has since mandated that accredited centers maintain detailed data on all PCI patients • Track outcomes with respect to predictor variables
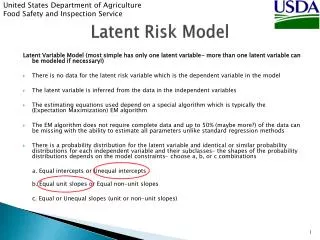
Current Risk Model StandardLogistical Regression (LR) • Type of generalized non-linear model • Used in analysis of a binary outcome • Bounded by 0 and 1 • Produces Coefficients/Odds Ratios and an intercept • Variable selection • From All Available Data • Known Risk Factors from Prior Studies • Selected Subset of data based on Study Design
SummaryLogistic Regression • Advantages • Straightforward • Intuitive results in the form of odds ratios • Disadvantages • Presumes independence between variables • Difficulty in applying model to different geographies and time periods • Missing data points assumed to be negative findings
Alternative Risk ModelBayesian Network (BN) • Advantages • Can incorporate variable co-dependencies • Provides a method for the estimation of unknown variables, i.e., reasoning under uncertainty • Easy to retrain • Provides a graphical representation of variable relationships • Disadvantages • Accuracy of network is dependent on nodal connections
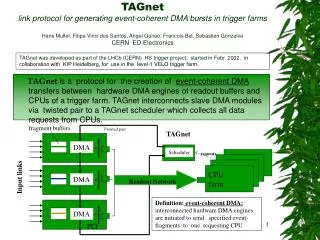
Bayesian Network Methodology • Directed acyclic graph (DAG) consisting of • Nodes • Directed links between nodes • Conditional probability tables (CPT) • Assumptions of conditional dependence and independence based on expert opinion or machine learning algorithms • Prior and conditional probabilities are developed using existing data or expert opinion
Study Hypothesis • A BN will provide a better case level estimation of risk than a model developed using standard LR techniques
Source Data • Brigham & Women’s Hospital • Interventional Cardiology Database • January 1, 2002 – October 30, 2004 • 5383 Cases • 2/3 Training Cases (3588) • 1/3 Test Cases (1795) beginning October 27, 2003
Logistic Regression ModelDevelopment • Backwards Stepwise Technique • Exclusion Threshold P >= 0.10 • Inclusion Threshold P >= 0.05 • Variables Evaluated: 35 • Continuous Variables Discretized • STATA 8.2 (College Station, Texas)
Methods – BNNaïve BN Netica Release 2.17 (Norsys Software Corp., Vancouver, BC, Canada)
Discrimination • A model’s ability to distinguish between patients who die and those who survive • Although a Model calculates an outcome probability, the classification of a case into death vs. survival is based on an arbitrary threshold • This threshold determines the sensitivity and specificity of the prediction • ROC curves graph the sensitivity vs. 1-specificity at different thresholds • The discriminatory performance of the model is estimated by the area under the ROC curve
Calibration • Measures how close the model’s estimates are to the “true” probability • The “true” probability is the probability of death for a similar patient population • Provides an estimation of case level accuracy • Accuracy of the statement “The risk of death from PCI in patients like you is 1 in 1,000.” • Hosmer-Lemeshow’s Goodness-of-Fit Test • Ranks population by probability estimate • Divides population into equal subsegments • Calculates how well the observed and expected frequencies match
Discussion • Discrimination • All Models had excellent performance • None of the models was significantly different in performance • Calibration • Two models achieved calibration on the training set: Logistic Regression & Naïve Bayes • The only model to retain calibration on the test set was the Naïve Bayes Model
Limitations • The CPTs for hidden nodes within our BNs were built using a machine learning algorithm • Data reporting and database quality would be expected to improve over time • Ambiguity between ‘absent’ and ‘negative’ values for some database fields • Attempts to develop more realistic Bayesian Networks were limited by software failures
Conclusions • Calibration is essential for any test where case level accuracy is important • The only model that retained calibration with the test set was the naïve BN • This study supports the use of a Naïve Bayesian Network for case level estimation in pre-procedural PCI risk assessment as an alternative to logistic regression