Download
1 / 38
380 likes | 382 Views
Learn how satellite data can be used to predict coral bleaching caused by thermal stress. Explore the causes, consequences, and solutions for coral bleaching. Access online tutorials, resources, and lesson plans for educators and students.

E N D
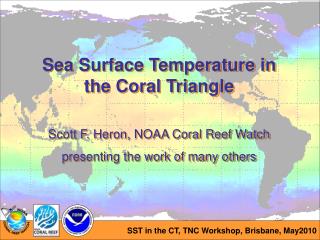
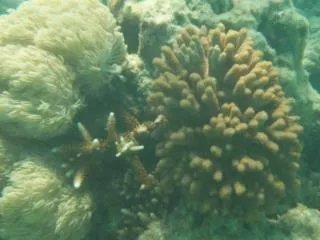
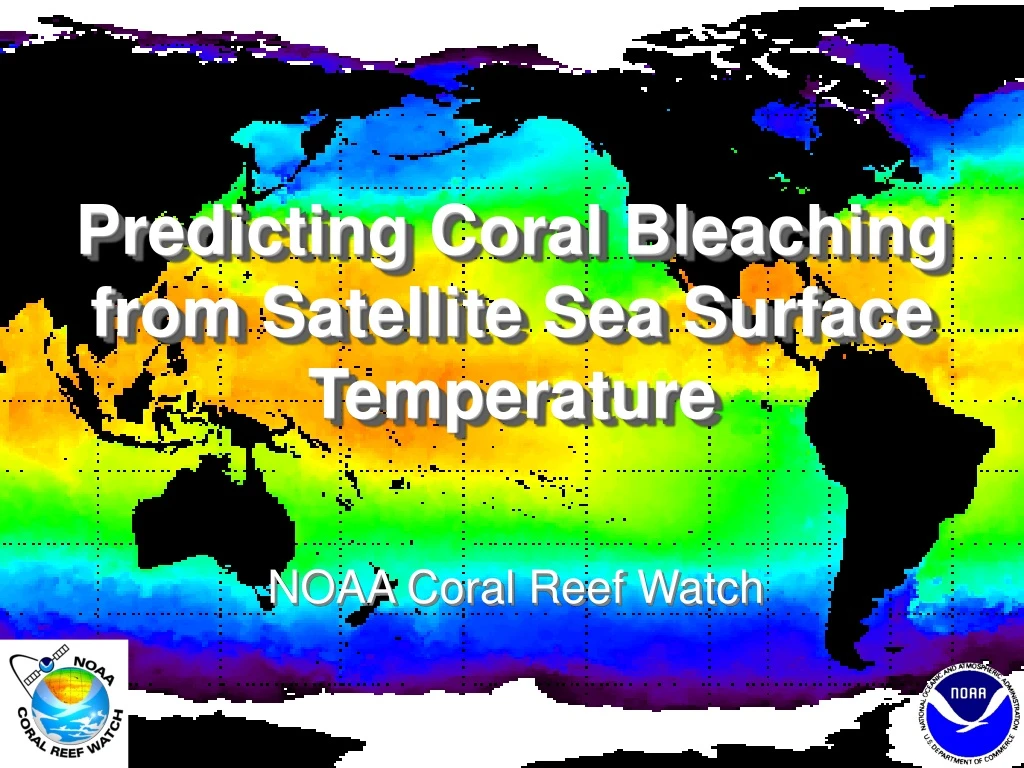
Predicting Coral Bleaching from Satellite Sea Surface Temperature NOAA Coral Reef Watch
Corals live in symbiosis with algae Stress Corals release their algae
Causes of Coral Bleaching Many local problems can cause bleaching: Freshwater from floodsPollutionDiseaseSedimentCyanide fishing
Causes of Coral Bleaching But only one thing causes bleaching at a Regional or Global scale Temperature !!!When the water gets hot and stays hot,corals will bleach
Thermal Stress Causes Mass Coral Bleaching and Mortality
What are the consequences? • Environmental impacts • Loss of coral • Changes in reef community • Loss of biodiversity • Economic impacts • Decreased tourism appeal • Fishery decline • Loss of ecosystem “services” • Subsistence fishing • Recreation • Cultural significance • Shoreline protection
using satellite sea surface temperature to predictcoral bleaching
NOAA’s polar-orbiting POES satellites view most of the earth’s surface every day. What satellites do we use? Animation from the COMET Program (http://www.comet.ucar.edu/)
If you stand next to a fire, you can feel the heat on your skin. Satellite uses this infrared radiation to “feel” how warm the ocean is. How do we measure the temperature of the ocean from 850km above the surface?
Sea Surface Temperature updates available FOR FREE at: coralreefwatch.noaa.gov/satellite
Sea Surface Temperature Anomaly Is today’s temperature above or below average for this location at this time of year?
Bleaching Threshold Temp Maximum monthly mean: Average temperature for the warmest month Bleaching Threshold: One degree above Maximum Monthly Mean (MMM + 1°C) Varies with latitude and local conditions: Gulf of Oman: 33.5° Florida Keys: 30.3° Oahu, Hawaii: 28.0° Galapagos: 27.5°
Coral Bleaching HotSpots Is today’s temperature above the average for the warmest month?
Degree Heating Weeks (DHW) How much thermal stress has built up over the past three months?
Degree Heating Weeks (DHW) Temperature and duration combined: °C – weeks 10 DHWs could be: 1 degree above MMM for 10 weeks 2 degrees above for 5 weeks 0.5 degrees above for 20 weeks How much thermal stress has built up over the past three months?
Use of DHW to predict coral bleaching DHW = 0 No Thermal Stress DHW >= 4 Thermal Stress leading to significant bleaching DHW >= 8 Thermal Stress leading to wide spread bleaching and significant mortality
Online tutorial Web pages: how we predict coral bleaching from satellite temperature data Hands-on exercises Made for coral reef managers Also appropriate for high-school students Education Resources
Online tutorial Coral Bleaching Remote Sensing Sea Surface Temperature Bleaching HotSpots What can be done? References Online Resources Education Resources
Lesson plans Focused on satellite technology, coral biology, and coral reef conservation Fun, hands-on science activities engage students in learning 4th - 6th grade students Education Resources
Lesson plans Remote Sensing & Electromagnetic Spectrum Satellite Altimetry Phytoplankton and Ocean Color Coral Reefs: Symbiosis and Anatomy Temperature and Coral Bleaching Coral Reef Conservation Education Resources
http://coralreefwatch.noaa.gov/satellite/education/ For all of NOAA’s coral reef education resources: http://coralreef.noaa.gov/outreach/welcome.html Education Resources
Activity: Using NOAA Satellite Data to Keep Watch on Coral Reefs
Activity • Divide the room into four groups: • Bermuda • U.S. Virgin Islands • Puerto Rico • Bahamas • Answer questions based on the 2005 Caribbean bleaching event
Activity Answer the questions on your handout Work in groups We will come back together to discuss the answers.
Activity: Q & As • What were the local conditions at your reef on September 2nd, 2005? • 1. What was the temperature at your reef on that day? • B: 28°C; LSI: 30°C; PR: 29°C; USVI: 29°C • 2. Was your site unusually warm? If so, what was the anomaly? • B: +0.75°C; LSI: +0.22°C; PR: +0.75°C; USVI: +1°C
Activity: Q & As • How hot was the whole late Summer / early Fall season? • 3a. How was the highest temperature? • B: 28.5°C; LSI: 31°C; PR: 30.5°C; USVI: 30°C • 3b. How long did the temperature stay at or above the threshold? • B: about a month; LSI: 1 month, then a decrease, then another month; PR: 2 months; USVI: 3½ months • 4. How high did the DHWs get? • B: 3 DHW; LSI: 6 DHW; PR: 8 DHW; USVI: 11 DHW • 5. How severe do you think the bleaching was? • B: mild, if any; LSI: moderate; PR: severe; USVI: very severe
Activity: Q & As • How stressed was your reef site compared to other reefs in the Caribbean region? • 6. How did the thermal stress at your site compare to the stress experienced by the other three reefs highlighted in this exercise? • B < LSI < PR < USVI • 7. How severe do you think the bleaching was at your site compared to the other three reefs? • B < LSI < PR < USVI
Activity: How bad was the 2005 Bleaching? > 1500 on-site surveys Each dot represents the average percentage of the coral colonies that were bleached at that location.
Activity: How bad was the 2005 Bleaching? • Bleaching surveys within 50 km of the four sites used for this exercise • Bleaching was worst in the US Virgin Islands • Puerto Rico and Lee Stocking Island were statistically identical • Bermuda < 1% of coral colonies bleached.
Are there signs of hope for bleaching? This reef in Palau was devastated by bleaching in 1998. Ten years later, the reef is covered with healthy corals. If conditions are favorable, reefs can recover: good water quality low fishing pressure many grazing fish low nutrient pollution Image from Peter Mumby, University of Exeter (more at http://www.reefvid.org/)
Are there signs of hope for bleaching? • Local managers can: • Reduce bleaching • Reduce light stress • Cool reefs, increase mixing • Increase survival • Improve water quality • Reduce disease prevalence • Aid recovery • Coral fragmentation • Encourage recruitment • Protect ecosystem functions (herbivory)
After bleaching and death of corals…. Sensitive coral species are killed…. The corals that remain are the ones that can tolerate higher temperatures. Result? Less diversity, but the reef as a whole develops bleaching resistance. Are there signs of hope for bleaching?
Are there signs of hope for bleaching? Some places are heating more slowly than others These regions may act as natural refuges where coral reefs may survive.