Download
1 / 1
10 likes | 179 Views
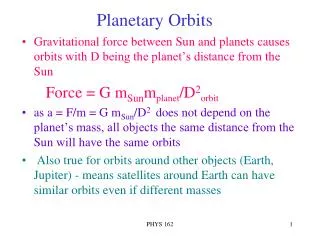
Cluster Magnetopause/Cusp. MHD Simulation Interval. V sw. P dynamic. P thermal. Wind data. Cluster ~ 10-11 LT. P magnetic. GOES. B z. Geotail. X. D st. 49% dawn 24% dusk 22% nose 5% tail. 40% dawn 23% dusk 33% nose 4% tail.

E N D
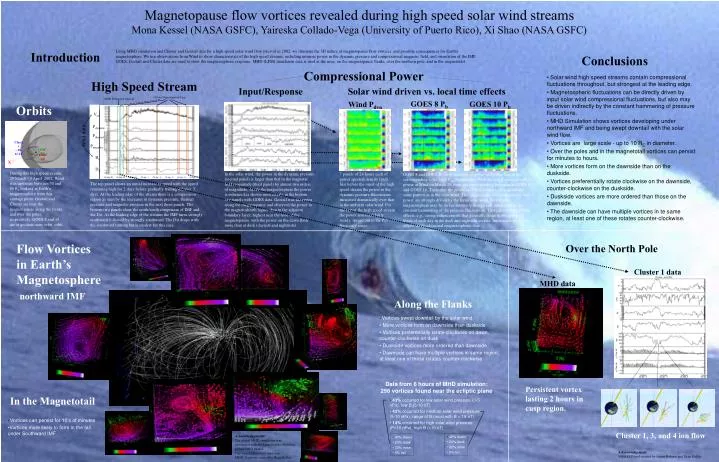
Cluster Magnetopause/Cusp MHD Simulation Interval Vsw Pdynamic Pthermal Wind data Cluster ~ 10-11 LT Pmagnetic GOES Bz Geotail X Dst • 49% dawn • 24% dusk • 22% nose • 5% tail • 40% dawn • 23% dusk • 33% nose • 4% tail Magnetopause flow vortices revealed during high speed solar wind streamsMona Kessel (NASA GSFC), Yaireska Collado-Vega (University of Puerto Rico), Xi Shao (NASA GSFC) Using MHD simulation and Cluster and Geotail data for a high speed solar wind flow interval in 2002, we illustrate the 3D nature of magnetopause flow vortices, and possible consequences for Earth's magnetosphere. We use observations from Wind to show characteristics of the high speed streams, including intrinsic power in the dynamic pressure and compressional magnetic field, and orientation of the IMF. GOES, Geotail and Cluster data are used to show the magnetospheric response. MHD (LFM) simulation data is used at the nose, on the magnetopause flanks, over the northern pole, and in the magnetotail. Introduction Conclusions Compressional Power • Solar wind high speed streams contain compressional fluctuations throughout, but strongest at the leading edge. • Magnetospheric fluctuations can be directly driven by input solar wind compressional fluctuations, but also may be driven indirectly by the constant hammering of pressure fluctuations. • MHD Simulation shows vortices developing under northward IMF and being swept downtail with the solar wind flow. • Vortices are large scale - up to 10 RE in diameter. • Over the poles and in the magnetotail vortices can persist for minutes to hours. • More vortices form on the dawnside than on the duskside. • Vortices preferentially rotate clockwise on the dawnside, counter-clockwise on the duskside. • Duskside vortices are more ordered than those on the dawnside. • The dawnside can have multiple vortices in te same region, at least one of these rotates counter-clockwise. High Speed Stream Input/Response Solar wind driven vs. local time effects GOES 8 Pb GOES 10 Pb Wind Pdyn Orbits During this high speed stream, 29 March - 5 April 2002, Wind was upstream between 70 and 80 RE looking at Earth’s magnetosphere from this vantage point. Geotail and Cluster are near the magnetopause along the flanks and over the poles, respectively. GOES 8 and 10 are at geostationary orbit. orbit. In the solar wind, the power in the dynamic pressure (second panel) is larger than that in the magnetic field magnitude (third panel) by almost two orders of magnitude. Inside the magnetosphere the power is enhanced as shown most clearly in the bottom two panels with GOES data. Geotail was skimming along the magnetopause and observed the power in the magnetosheath higher than in the adjacent boundary layer; highest near the nose of the magnetopause, with the power on the dawn flank more than at dusk (dayside and nightside). 7 panels of 24 hours each of power spectral density (psd). Just before the onset of the high speed stream the power in the dynamic pressure fluctuations increased dramatically over that in the ambient solar wind. For the rest of the high speed stream the power remained fairly steady, spread out in the Pc5 frequency range. GOES 8 and GOES 10 show less overall power in |B| than that in the corresponding solar wind Pdyn fluctuations. With the initial increase in Pc5 power at Wind on March 29, there are corresponding increases at GOES 8 and GOES 10. Thereafter the power at GOES orbit does not follow the same pattern as in the solar wind. This suggests the early fluctuations and power are strongly driven by the input solar wind, but then the magnetosphere may be driven internally though still influenced by the constant hammering of the pressure fluctuations. There are also local time effects, e.g., strong enhancements that generally occur in the first eight hours of each day in the dusk and nightside sectors. Interpretation of these effects needs additional magnetospheric data. The top panel shows an initial increase in speed with the speed remaining high for 2 days before gradually trailing off over 3 days. At the leading edge of the stream there is a compression region as seen by the increases in dynamic pressure, thermal pressure and magnetic pressure in the next three panels. The bottom two panels show the north/south component of IMF and the Dst. At the leading edge of the streams the IMF turns strongly northward followed by strongly southward. The Dst drops with the southward turning but is modest for this case. Flow Vortices in Earth’s Magnetosphere northward IMF Over the North Pole Cluster 1 data MHD data Along the Flanks • Vortices swept downtail by the solar wind • More vortices form on dawnside than duskside • Vortices preferentially rotate clockwise on dawn, counter-clockwise on dusk • Duskside vortices more ordered than dawnside • Dawnside can have multiple vortices in same region, at least one of these rotates counter-clockwise Data from 6 hours of MHD simulation: 256 vortices found near the ecliptic plane Persistent vortex lasting 2 hours in cusp region. In the Magnetotail • 43% occurred for low solar wind pressure (0-5 nPa), low B (5-10 nT) • 43% occurred for medium solar wind pressure (5-10 nPa), range of B (most with B > 15 nT) • 14% occurred for high solar wind pressure (P>10 nPa), high B (>10 nT) • Vortices can persist for 10’s of minutes • Vortices more likely to form in the tail under Southward IMF Cluster 1, 3, and 4 ion flow Acknowledgements: The global MHD simulation was conducted with the Lyon-Fedder-Mobbary global MHD model. The visualization tool used was MHD_Explorer created by Ryan Boller. Acknowledgement: ViSBARD tool created by Aaron Roberts and Ryan Boller.