Download
1 / 27
270 likes | 372 Views
Aquatic environmental assessment of main rivers around Lake Taihu, China. Guiping Li, Zhongbo Yu, Yiping Li & Kumud Acharya Hohai University, Nanjing, China li_gui_ping@126.com. Taihu Basin.

E N D
Aquatic environmental assessment of main rivers around Lake Taihu, China Guiping Li, Zhongbo Yu, Yiping Li & Kumud Acharya Hohai University, Nanjing, China li_gui_ping@126.com
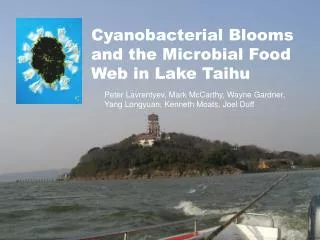
Taihu Basin Lake Taihu is located in the east of China. Taihu basin only accounts for 0.4% of the country land area and 4% of the national population while produces about 11.6% of national total GDP.
The water quality of Lake Taihu June, 2007 May, 2008 May, 2008 May, 2009
Background and research objectives □Thepollutions in Lake Taihu mainly come from the discharge of industrial wastewater, agricultural pollutions and domestic sewage . □ Rivers around Lake Taihu are the major carriers of pollutions. □ Therefore, to evaluate the water quality of the major rivers and to identify the principal impact factors and their spatial and temporal distributions are the keys to water pollution management. Reality
Sampling stations ● The sampling stations are locatedat the entrance and exit of each river.
Parameters ● Water quality parameters include WT, transparency, DO, pH, NO2-N, NO3-N, TN, SS, BOD5, CODMn, TP NH3-N, and petroleum. Water samples- Monthly, from 2000 to 2004
Methods □ Cluster analysis (CA) was used to evaluate information about similarity groups between sampling stations to recognize water quality variations in river water. □ Principal component analysis (PCA) is used to obtain the temporal and spatial variations and to identify potential pollution sources
Data processing of cluster analysis • Data transformation (Standardization first to eliminate the impact of dimension) Step1 • Calculate the cluster statistic (Euclidean distance and similarity coefficient) Step2 • Choose the clustering method (Between-groups linkage method ) Step3
Principal component analysis ● Quantify the most significant impact factors for the aquatic environment. ● Recombine the original parameters to reduce the dimensions ,the new principal variables can be used to represent the original data and preserve the most information.
Data processing of principal component analysis • Standardize first to eliminate the impact of dimension Step1 • Calculate the correlative coefficient matrices, eigenvalue and eigenvector matrices Step2 • Calculate the Contribution Rate of variance and determination the principal parameters Calculate the trophic state based on the product of each principal parameters and variance contribution rate Step3 Step4
Change of TN Changes of mean values attributed to same class based on monthly data, from 2000 to 2004 in main rivers. Units: mg/l.
Change of TP Changes of mean values attributed to same class based on monthly data, from 2000 to 2004 in main rivers. Units: mg/l.
Change of BOD5 Changes of mean values attributed to same class based on monthly data, from 2000 to 2004 in main rivers. Units: mg/l.
Change of DO Changes of mean values attributed to same class based on monthly data, from 2000 to 2004 in main rivers. Units: mg/l.
Principal component equations (1) F1=0.136•WT-0.037•transparency-0.307•DO-0.156•PH+ 0.340 • NO2-N+0.133•NO3-N+0.362 •NH4-N﹢0.379•TN-0.045• SS+ 0.353• BOD5+0.328 • CODMn + 0.369 •TP + 0.288 • petroleum (2) F2=-0.010•WT+0.588• transparency +0.178•DO+0.368 •PH+0.116 • NO2-N﹣0.355• NO3-N +0.139•NH4-N+0.048•TN-0.546•SS + 0.144•BOD5+0.060•CODMn-0.018•TP-0.050 •petroleum (3) F3=-0.513•WT-0.332•transparenc+0.350•DO+0.534•PH+ 0.056• NO2-N-0.082•NO3-N+ 0.068•NH4-N+0.075•TN+0.281•SS+ 0.156 • BOD5+0.278•CODMn+0.136•TP+0.013 •petroleum
The principal factors According to the analysis mentioned above, NH3-N, BOD5,NO3-N, TN, TP and CODMn played the most significant role in water quality.
Conclusions 1. Cluster analysis grouped 27 rivers into six groups of similar water quality features. Group 6 had the highest nutrient levels. These rivers are mainly located in the north of Lake Taihu. 2.The result of principal component analysis showed NH3-N, BOD5,NO3-N, TN, TP and CODMnwere the most significant parameters contributing to water quality. 3. The Rivers located in the north of Lake Taihu are seriously contaminated.
Acknowledgement Taihu Basin Authority of the Ministry of Water Resources Thank You !