Download
1 / 9
90 likes | 202 Views
Can we predict the cost of subway fare from the price of a slice of pizza?.

E N D
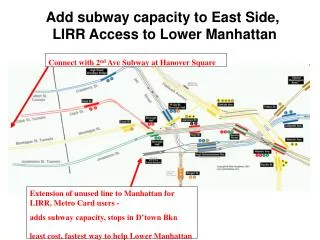
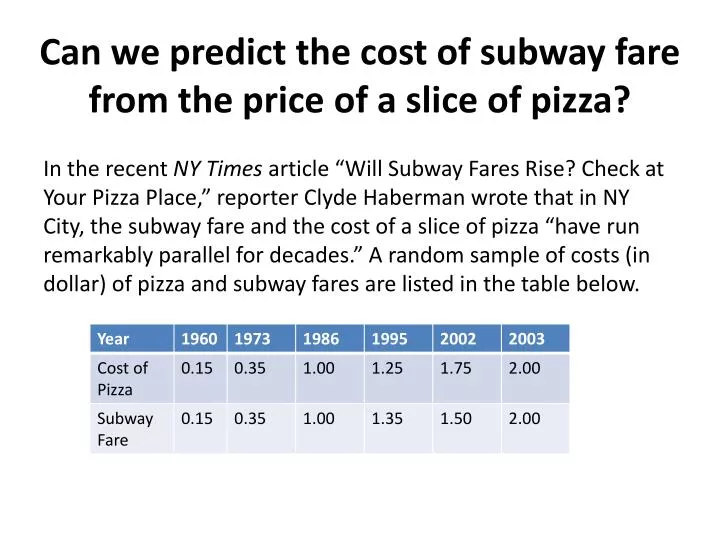
Can we predict the cost of subway fare from the price of a slice of pizza? In the recent NY Times article “Will Subway Fares Rise? Check at Your Pizza Place,” reporter Clyde Haberman wrote that in NY City, the subway fare and the cost of a slice of pizza “have run remarkably parallel for decades.” A random sample of costs (in dollar) of pizza and subway fares are listed in the table below.
To see the relationship between the price of a pizza slice and the subway fare, we can make a scatter plotin Excel:
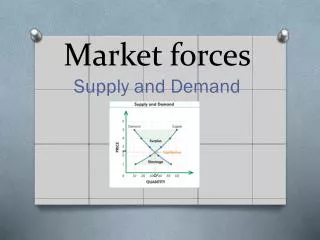
What is correlation? Correlation measures the strength of a linear relationship between 2 variables (like the price of pizza and the subway fare) • Variables can be positively or negatively correlated: • Positive correlation: As the value of one variable increases, so does the value of the other variable. • Negative correlation: As the value of one variable increases, the value of the other variable decreases. • r = correlation coefficient • r is between -1 and 1 • Indicates the “strength” of the correlation, ignoring the sign
Examples of different r values r =1.00 r = .42 r =.85 r =-0.98 r =.17
In case of a non-linear relationship the value of r will be close to 0.
Back to pizza price & subway fare… To find the correlation coefficient r in Excel, type in: Column A Column B =CORREL(A2:A7, B2:B7) In this case, r = 0.9878. This indicates that there is a strong positive linear relationship between the two variables. Row 2 Row 7
In fact, we can go one step farther! Question: What proportion of the variation in the subway fare can be explained by the variation in the costs of a slice of pizza? Answer: Find r2 With r = 0.988, we get r2 = 0.976. This means that about 97.6% of the variation in the cost of subway fares can be explained by its linear relationship with the cost of pizza. This implies that about 2.4% of the variation in costs of subway fares cannot be explained by the costs of pizza. CAUTION: This does not mean that increases in pizza sales cause increases in subway fares. Both costs might be affected by some other variable lurking in the background!
How to see into the future In Excel scatter plot, go to Chart tools Layout Trendline Linear Trendline Excel can figure out the equation of this line for you! Just go to “More Trendline Options…”
How to see into the future, cont’d. Now you can use the trendline to make predictions! y = 0.945x + 0.0346 Example: When the cost of a pizza slice was $1.25, what was the cost of subway fare? y = 0.945(1.25) + 0.0346 = $1.22 Example: When the cost of a pizza slice is $2.25, what will the cost of subway fare be? y = 0.945(2.25) + 0.0346 = $2.16 Example: When the cost of a pizza slice is $20, what will the cost of subway fare be? y = 0.945(20) + 0.0346 = $18.94 Not an “appropriate” prediction!