Download
1 / 17
190 likes | 367 Views
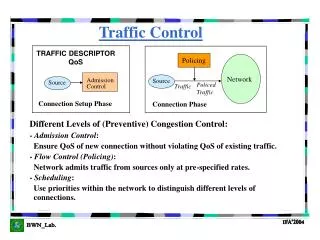
Why traffic control works. A demonstration with a walking experiment …. Hans van Lint, Ramon Landman & Andreas Hegyi, Transport & Planning. How does congestion occur?. Some preliminaries …. Inflow Q. As long as the inflow is lower than capacity no problem!. How does congestion occur?.

E N D
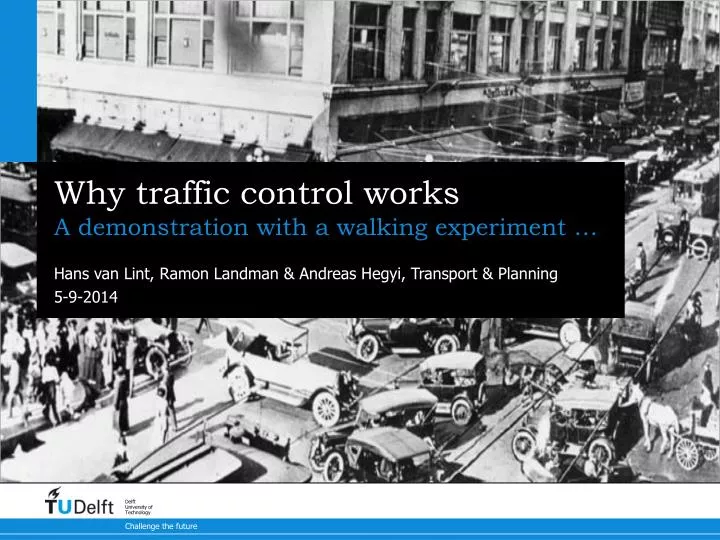
Why traffic control works A demonstration with a walking experiment … Hans van Lint, Ramon Landman & Andreas Hegyi, Transport & Planning
How does congestion occur? Some preliminaries … InflowQ As long as the inflow is lower than capacity no problem!
How does congestion occur? Some preliminaries … InflowQ • As soon as inflow is higher than capacity • Speed drops • A traffic jam grows in the opposite direction of traffic
How things go from bad to worse The blocking back phenomenon • Now suppose there is a lever with a ball on it somewhere halfway the bottle • Once the water reaches it, the lever will tilt and the ball will run down the slide and block the bottleneck
How things go from bad to worse The blocking back phenomenon • Now suppose there is a lever with a ball on it somewhere halfway the bottle • Once the water reaches it, the lever will tilt and the ball will run down the slide and block the bottleneck • This causes a very serious reduction in the outflow! Result: problem goes from bad to worse
This also happens in real traffic! The blocking back phenomenon • In traffic networks blocking back may put entire cities in a state of gridlock
Now what? The blocking back phenomenon • Blocking back (and ultimately gridlock) in traffic networks can ONLY be mitigated & prevented by traffic management / control: • Limiting access (perimeter control) / buffering • Redistributing the flow IN the network itself (i.e. rerouting) • Both will lead to more realized trips at a lower cost
Consider the following system A schematized city if you like Input (traffic demand) The system • Assume that from the total demand D (#travelers/hour) a fixed amount D* wants to go out (the remaining demand (D-D*)has internal destinations) • Now the only way out is through the ring road … Output (realized trips, total time spent) a buffer (could be the urban network) D The access point a ringroad
An experiment To demonstrate why traffic management is essential in preventing blocking back / gridlock • Assume the total demand is such that congestion will occur • Experiment A • do nothing and let nature take its course • Experiment B • use exactly the same demand as in experiment A, but now control the access point
Experiment A Let nature take its course (no control) …
Experiment B Control of access point (ramp metering)
Results of this experiment How do we compare the two situations? • Consider the cumulative inflow ND(t) of travelers with destination offramp, and the cumulative outflow NA(t) who actually succeeded to exit in experiment A • The horizontal distance between the curves equals the travel time • The surface between ND(t) and NA(t) = the sum of all these travel times, the total time spent (TTSA) The smaller TTS the better! Cum. inflow ND(t) TTSA (total time spent) Cumulative flow N(t) nth pedestrian travel time TTn= tn1-tn2 Cum. outflow NA(t) tn1 tn2 time
Results of this experiment How do we compare the two situations? Cum. outflow NB(t) • In experiment B we had exactly the same cumulative demand ND(t) but a different cumulative outflow NB(t). Again the surface between these depict total time spent (TTSB) • If we plot also NA(t) in the same graph, the surface between NB(t) and NA(t) obviously equals the difference in total time spent, that is: Performance = TTSB - TTSA Cum. inflow ND(t) TTSB TTSB-TTSA Cumulative flow N(t) Cum. outflow NA(t) time
Results of this experiment TTSB-TTSA = 89 Person minutes (1½ person hours) Which is equal to (depending on the average value of one person hour) a bottle of (pretty good) whine
Is there a catch? Some common misconceptions • Hmmm, the experiments were just 7 minutes, how do we “save” 89 person minutes in 7 minutes ??? Look at the table on the previous page. For example, in the 6th minute 25 extra people were served in Experiment B than in Experiment A. That’s two travelers for the price of one! Do that for every minute and you get a total of 89 minutes “profit” • But it’s an unfair comparison! You just exchange delay on the track for some extra waiting time in the buffer, right? WRONG! Even if we have increased delays in the buffer slightly we gained much more on the track and in the end served more people at a lower cost
Is there a catch? Some common misconceptions • Wait a minute, the comparison still is unfair, the second time more people were selected to take the off ramp! NOT TRUE! In both experiments exactly the same amount of travelers per minute were selected to exit, but the second time, much more of them were actually served. So same demand, but different performance! • Ok, but shouldn’t you repeat this experiment enough times to get a statistically sound answer, this is just two single draws! CORRECT! But although this was a demo, we can be pretty sure (that’s an understatement) that also the mean difference in TTS of 1,000 experiments A and B would still lead to comparable results. Traffic management helps!
Thanks! • Hans van Lint (associate professor), Ramon landman (PhD candidate) and Andreas Hegyi (assistant professor) are with the Transport and Planning department at the faculty of Civil Engineering and Geosciences (www.transport.citg.tudelft.nl) • The experiment was performed November 23, at the 2010 TRAIL conference (www.rstrail.nl) • Many thanks to Kees Landman for shooting it on video and for all volunteers (pushers, counters, time keepers) who helped out on the day!

![[M2] Traffic Control](https://cdn1.slideserve.com/3370967/m2-traffic-control-dt.jpg)

![[M2] Traffic Control](https://cdn2.slideserve.com/4578602/m2-traffic-control-dt.jpg)