Download

1 / 48
500 likes | 681 Views
Energy Density: Packing Strategies to Reduce Consumption of High Energy Dense Foods. L. Michele Maynard, Ph.D. Diane Thompson, RD, MPH Raegan Tuff, MPH Laura Lessard, MPH Division of Nutrition, Physical Activity and Obesity Centers for Disease Control and Prevention.

E N D
Energy Density: Packing Strategies to Reduce Consumption of High Energy Dense Foods L. Michele Maynard, Ph.D. Diane Thompson, RD, MPH Raegan Tuff, MPH Laura Lessard, MPH Division of Nutrition, Physical Activity and Obesity Centers for Disease Control and Prevention State Program Orientation Training November 12, 2008
Overview • Define energy density • Review scientific evidence • Describe main strategies for reduction of HED • Describe DNPAO’s direction for energy density • Review environmental policies to reduce energy intake • Methods • Strategies • Current Practices • Menu Labeling/restaurant programs • Zoning • Vending Machines
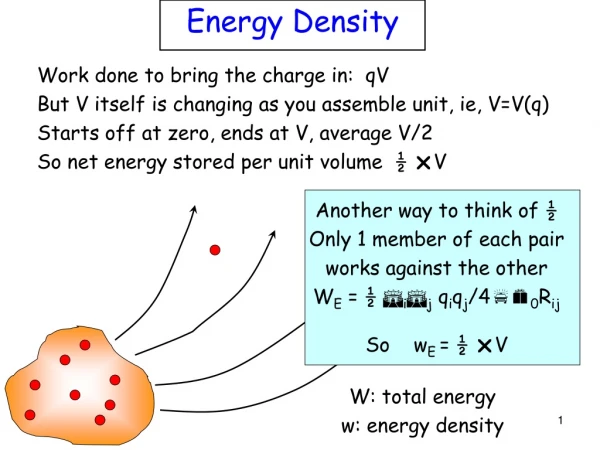
Energy Density • Energy density is the amount of calories in a particular weight of food and is generally presented as the number of calories in a gram (kcal/g). • Low energy dense foods provide fewer calories per gram than foods with higher energy density.
Fat 9 kcal/g Carbohydrate 4 kcal/g Alcohol 7 kcal/g Protein 4 kcal/g Water 0 kcal/g Fiber 1.5 – 2.5 kcal/g Energy Density of Food Components
Fat 9 kcal/g + = Fat + Water 4.5 kcal/g Water 0 kcal/g Adding water reduces energy density
Population-based Studies Adults consuming a low energy dense diet: • Have lower energy intakes • Consume the same or more food by weight • Consume higher quality diets (higher in fiber, Vitamins A, C, B6, folate, iron, calcium and potassium) (Ledikwe et al 2006; Cuco et al 2001; Stookey 2001; Drewnoski et al 2004; Savage et al, 2008; Schroder et al, 2008; Ledikwe et al 2007)
Population-based Studies • Normal weight adults consume lower energy dense diets than obese. • Higher energy dense diets are associated with higher BMI values. • Prevalence of obesity is lowest among those consuming a high intake of fruits and vegetables. • Weight gain is attenuated among women consuming lower energy dense diets. (Ledikwe 2006, Kant 2005; Howarth 2006; Stookey 2001, Marti-Henneberg et al 1999; Cox and Mela 2000; Savage et al, 2008; Ledikwe et al 2007)
Experimental Studies Participants consuming diets lower in energy density: • Exhibited lower energy intakes • Consumed a similar amount of food by weight. • Reported no increase in hunger (Duncan 1983, Shintani 1991, Shintani 2001, Bell 1998; Ledikwe et al 2007)
Experimental Studies • Consuming a LED food prior to a meal can be an effective strategy for moderating energy intake. (Rolls 1999; Rolls 2004)
150 gram salads Low ED 0.33 kcal/g MediumED 0.67 kcal/g High ED 1.33 kcal/g 300 gram salads First Course Pre-load 50 kcal 100 kcal 200 kcal 100 kcal 200 kcal 400 kcal Rolls et al, 2004
Intake was influenced by both energy density and portion of salad Rolls et al., 2004
Clinical Studies • Obese patients counseled to consume a reduced energy diet lost 6.3 kg over 7 months. • Incorporation of a LED food into a reduced energy diet led to a 7.2 kg weight loss among overweight or obese adults over 1 year. • Obese women counseled to eat more F & V while consuming less fat lost 7.9 kg over 1 year (Fitzwater 1991; Rolls 2005; Ello-Martin 2004; Ledikwe et al 2007)
Strategies to Reduce Consumption of High Energy Dense Foods of Low Nutritive Value
Strategies to Reduce Consumption of High Energy Dense Foods of Low Nutritive Value • Substitute low-energy-dense foods for high-energy-dense foods • Decrease the portion size of high-energy-dense foods • Limit availability of high-energy-dense foods [See Nutrition, Physical Activity and Obesity (NPAO) Technical Assistance Manual for more information]
Using RE-AIM to Select and Evaluate Strategies • RE-AIM • Reach into the target population • Efficacy or effectiveness • Adoption by target settings or institutions • Implementation—consistency of delivery of intervention • Maintenance of intervention effects in individuals and populations over time. • Can be used to systematically decide which strategies to implement • Can be used to estimate the impact of a strategy
DNPAO’s Direction for Energy Density • Energy Density Work Group • Progress to date (planning meeting) • Policy • Education • Economics/incentives • Products • Guidance Document • Policy Position Papers
SEARCH SOURCES (databases, reference lists, reviews) INTERVENTION POLICY ABSTRACTION Program Description FINDINGS & RECOMMENDATIONS CDC Guidance Documents Policy Search: Methods
Energy Density Strategies • Menu labeling/nutrition information • Restaurant programs increase availability of healthful foods • Zoning to limit/restrict Fast Food restaurants • Worksite vending policies • Guidelines for healthy foods offered at meetings and catered events • Point of purchase labeling • Pricing of healthful food items • Product placement • Childcare nutrition standards/policies
Current Practice: MethodsData Sources • NPAO Progress Monitoring Report • The 40 STEPS- funded community projects 2007 progress monitoring report • Prevention Institute ENACT local policy database • National Association of Counties Healthy Counties Database • Robert Wood Johnson Foundation funded report "Balance”
Kids Eating Out • ~1/3 of a child’s daily calorie intake comes from food prepared outside the home, twice the amount 30 years ago. • Children eat almost twice as many calories in restaurant meals compared to meals at home (770 vs. 420 calories) • 93% of kids menus are high in calories (>430 calories)
956 cal. (58%) 796 cal. (53%) 516 cal. (44%) 463 cal. (37%) Burton S, Creyer EH, Kees J, Huggins K. (2006) Attaching the Obesity Epidemic: The Potential Health Benefits of Providing Nutrition Information in Restaurants American Journal of Public Health, 96, 9 1669-1675. Most Consumers Underestimate Calorie Content
Dietitians’ estimates of the calorie content of popular restaurant foods food itemaverage calorieactual caloriepercent estimatecontentdifference Whole milk (1 c) 155 150 3% over Lasagna (2 c) 695 960 28% under Grilled chicken Caesar salad 440 660 33% under with dressing (4) Porterhouse steak dinner* 1,240 1,860 33% under Hamburger ( 10 oz.) and 865 1,550 44% under onion rings (11 rings) Tuna salad sandwich (11 oz.) 375 720 48% under *The dinner included a Porterhouse steak (untrimmed, 20 oz. before cooking) with a Caesar salad (2 cups), vegetable of the day (1 cup) and a baked potato with butter (1 tablespoon).
Restaurant Menu Labeling • Which restaurants would be subject to the rule? • Restaurants with 10 or more outlets with same trade name, regardless of ownership.
2. Where and in what manner should they be required to post information? Restaurant Menu Labeling • Menu boards and item tags • Calories • Adjacent to item • Font size at least as large as item name or price Subway Menu Board in NYC
Restaurant Menu Labeling • For which items should nutritional information be provided? • Standard menu items that appear for 30 -180 days per calendar year • Meal combos • For which items should nutritional information NOT be provided? • Condiments • Daily specials • Alcoholic beverages • Food itemized on case-by-case basis
Restaurant Menu Labeling • What nutritional informational should they be required to post? • Varies from calories ONLY to saturated fat, trans fat, carbohydrates, sodium • Number of individuals food item is intended to serve • “Recommended limits for a 2,000 calorie daily diet are 20 g of saturated fat and 2,300 mg of sodium”
Advantages of Menu Labeling • Available at point of decision making • Easily accessible • Easily visible • Allows for side-by-side comparisons • Price and nutrition information listed together allow customer to make trade-offs • Unlikely to be misplaced • Provides detailed nutrient information
Exit interviews of 7,318 diners at 275 restaurants (11 fast food chains), NYC Department of Health and Mental Hygiene, Am J Public Health, 2008 http://cspinet.org/new/pdf/nyc_study_graph.pdf
Reaction to menu labeling After discovering that the Friday’s pecan-crusted chicken salad, served with mandarin oranges, dried cranberries and celery, has 1,360 calories. “That surprised me the most because they market it as a healthy option…It’s like false advertising. You think it’s better than the burger and the fries. It’s misleading.”Vicki, 26, Manhattanhttp://www.msnbc.msn.com/id/25464987/
Calorie Labeling PoliciesState • California SB 1420. Food facilities: Nutritional Information • An act to add language to the Health and Safety Code relating to food facilities to either disclose nutritional information or calorie count information as defined.
Calorie Labeling PoliciesCity • New York - Amendment to Article 81 of the New York City Health Code - Calorie Labeling* • Effective July 1, 2007 food service establishments in New York City that sell food items whose portion size and content are standardized prominently display publicly available information about the calorie content of such items on menu boards and menus in an effort to facilitate patrons’ nutritional choices at time of purchase. *Evaluability studies
Restaurant ProgramsNutrition Labeling Colorado Smart Meal Seal* • The Smart Meal Seal” identifies menu items that meet specified nutritional criteria • McDonald’s will promote 11 meal combinations that meet the nutritional standards set by the state’s Smart Meal program. *Evaluability studies
Nutrition StandardsCity Policies • New York City nutrition standards for foods purchased and sold by city agencies • Nutrition standards for food, beverages, & snacks for sale in vending machines throughout the city of Baldwin Park, CA
Vending Machine PoliciesSummary • Placement of healthy foods: top 1/3 • Proportion of healthy foods: 50% • Calorie range: 150 -250 • Fat: 30-35% of total calories • Saturated fat: 10% of total calories • Trans fat varied (none, limited, no wording) • Sodium range: 200-480 mg • Sugar: 35% total calories • Other: fiber or carbohydrates
Guidelines for Offering Healthy Foods at Meetings, Seminars, and Catered Events – University of Minnesota School of Public Health Meeting Well – American Cancer Society Delicious and Nutritious Food Choices: Healthy Selections for Conferences – Brigham and Women’s Hospital Guidelines for Healthy Meetings – New York state Department of Health Center for Community Health Healthy Eating Guide – Corvallis, Benton County Healthy Eating Policies
Guidance Documents: Discussion • Identify common elements of policies and programs • Develop case studies of successful programs • Lessons learned • Tools and resources
Acknowledgements • Special Acknowledgement to the states and city programs for their practice-based policy efforts and the work of the following researchers that was included in this presentation. • Beth Tohill • Jenna Seymour • Lynn Silver • Mary Bassett • Jenny Ledikwe • Barbara Rolls • Margo Wootan