Download
1 / 4
40 likes | 179 Views
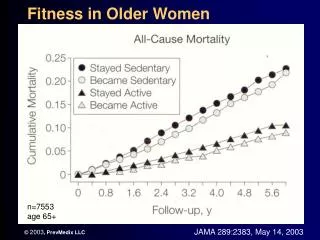
Predictive value of FRAX for fracture in obese older women. Osteoscoop - Issue N°285 – April 2013. BMI. FRAX = 10-year probability of major osteoporotic fractures. ♂ ♀. Femoral neck BMD. Age. Obese women N=285, age 71.0. Non obese women N=1509, age 72.3. 9.03 years ’ follow -up.

E N D
Predictive value of FRAX for fracture in obese older women Osteoscoop - Issue N°285 – April 2013
BMI FRAX = 10-year probability of major osteoporotic fractures ♂♀ Femoral neck BMD Age Obese women N=285, age 71.0 Non obese women N=1509, age 72.3 9.03 years’ follow-up FRAX + BMD FRAX + BMD
BMI FRAX = 10-year probability of major osteoporotic fractures ♂♀ Femoral neck BMD Age Obese women N=285, age 71.0 Non obese women N=1509, age 72.3 9,03 years’ follow-up FRAX + BMD FRAX + BMD Hip fractures 7.1% 11.4% Lowerthanobserved Lowerthanobserved
BMI FRAX = 10-year probability of major osteoporotic fractures ♂♀ Femoral neck BMD Age Obese women N=285, age 71.0 Non obese women N=1509, age 72.3 9.03 years’ follow-up FRAX + BMD FRAX + BMD Hip fractures 7.1% 11.4% Lower than observed Lower than observed 18.2% 23.3% Good calibration Good calibration Major osteoporotic fracture