Download
1 / 71
730 likes | 1.06k Views
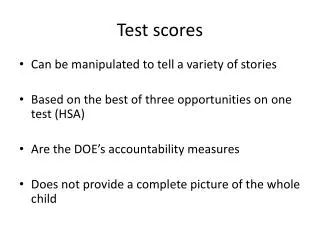
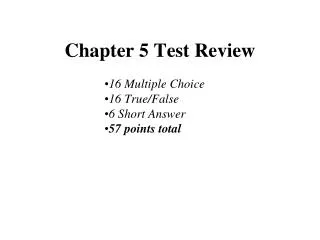
CHAPTER 5 Test Scores as Composites. This Chapter is about the Quality of Items in a Test. Test Scores as Composites. What is the Composite Test Score?

E N D
CHAPTER 5Test Scores as Composites This Chapter is about the Quality of Items in a Test.
Test Scores as Composites • What is the Composite Test Score? • A composite test score is a total test scorecreated by summing two or more subtest scoresi.e., WAIS IV Full Scale IQ consisted of 1-Verbal Comprehension Index, 2-Perceptual Reasoning Index, 3-Working Memory Index, and 4-Processing Speed Index. Qualifying Examinations and EPPP Exams are also composite test scores.
Item Scoring Schemes[skeems]SystemsWe have 2 different scoring system • 1. Dichotomous Scores Dichotomous Scores are restricted to 0 and 1 such as scores on True and False, and multiple-choice question • 2. Non-dichotomous Scores Non dichotomous Scores are not restricted to 0 and 1 Can have range of possible points such as in essays. 1,2, 3, 4, 5……..
Dichotomous Scheme Examples • 1. The space between nerve cell endings is called the a. Dendrite b. Axon ; c. Synapse d. Neutron (In this item, responses a, b, and d are scored 0; response c is scored 1.) • 2. Teachers in public school systems should have the right to strike. a. Agree b. Disagree (In this item, a response of Agree is scored 1; Disagree is scored 0) . Or, you can use True or False.
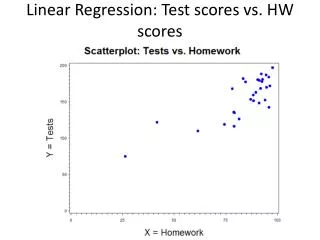
Practical Implication for Test Construction Variance and Covariance measure the quality of items in a test. Reliability and validity measure the quality of the entire test. • σ²=SS/N used by one set of data Varianceis the degree of variability of scores from mean.
Practical Implication for Test Construction Correlationis based on a statistic called Covariance (Covxy or S xy) COVxy=SP/N-1 used for 2 sets of data Covarianceis a number that reflects the degree to which 2 variables vary together. • r=sp/√ssx.ssy
Variance • X σ² = ss/N Pop 1 s² = ss/n-1 or ss/df Sample 2 4 5 SS=Σx²-(Σx)²/N SS=Σ(x-μ)² Sum of SquaredDeviation from Mean
Covariance • Covariance is a number that reflects the degree to which 2 variables vary together. • Original Data X Y 1 3 2 6 4 4 5 7
Covariance COVxy=SP/N-1 2 ways to calculate the SP SP= Σxy-(Σx.Σy/N) SP= Σ(x-μx)(y-μy) SP requires 2 sets of data SS requires only one set of data
Descriptive Statistics for Dichotomous DataItem Variance & Covariance
Descriptive Statistics for Dichotomous Data • P=Item Difficulties: P= (#of examinees who answered an item correctly / total # of examinees or P=f/N See handout The higher the P value The easier the item
Relationship between Item DifficultyP and σ² Variance σ² (quality) • 0 difficult 0.5 1 easy • P= Item Difficulty
Non-dichotomous Scores Examples • 1. Write a grammatically correct German sentence using the first person singular form of the verb verstehen. (A maximum of 3 points may be awarded and partial credit may be given.) • 2. An intellectually disabledperson is a nonproductive member of society. 5. Strongly agree 4. Agree, 3. No opinion 2. Disagree 1. Strongly disagree (Scores can range from 1 to 5 points. with high scores indicating a positive attitude toward intellectually disabled citizens.)
Variance of a Composite “σ²C” σ²=SS/N σ²a=SSa/Na σ²b=SSb/Nb σ²C= σ²a+σ²b Ex. From WAIS III-- FSIQ=VIQ+PIQ If More than 2 subtests, σ²C=σ²a+σ²b+σ²c…Calculate the variance for each subtest and add them up.
Variance of a Composite “σ²C” • What is the Composite Test Score? • Ex. WAIS IV Full Scale IQ which consist of a-Verbal Comprehension Index, b-Perceptual Reasoning Index, c-Working Memory Index, and • d-Processing Speed Index. • More than 2 subtests • σ²C=σ²a+σ²b+σ²c+σ²d
*Suggestions to Increase the Total Score Variance of a Test • 1-Increase the number of items in a test • 2-Item difficulties p (medium range) • 3-Items with similar content have higher correlations & higher covariance • 4-Item scores & total scores variances aloneare not indices(in-də-ˌcēz) of test quality (reliability and validity).
*1-Increase the Number of Items in a Test (how to calculate the test variance) • Variance for a test of 25 items is higher than a variance for a test of 20 items. • σ²=N(σ²x)+N(N-1)(COVx)= • Ex. If the COVx=items covariance = (0.10) σ²x=items variance (0.20) N=#of items in a test -- first try N=20 σ²=test variance For 20 items 42 , then try N=25 and σ²=test variancefor 25 items 65
2-Item Difficulties • Item difficulties should be almost equal for all of the items and difficulty levels should be in the medium range.
3-Items with Similar Content have Higher Correlations & Higher Covariance
4- Item Scores & Total Scores Variances Alone are not Indices (in-də-ˌcēz) of Test Quality Variance and Covariance are important and necessary however, they are not sufficient to determine the test quality. To determine a higher level of test quality we use Reliability and Validity.
UNIT II RELIABILITY CHAP 6: RELIABILITY AND THE CLASSICAL TRUE SCORE MODEL CHAP 7: PROCEDURES FOR ESTIMATING RELIABILITY CHAP 8: INTRODUCTION TO GENERALIZABILITY THEORY CHAP 9: RELIABILITY COEFFICIENTS FOR CRITERION-REFERENCED TESTS
CHAPTER 6Reliability and the Classical True Score Model • Reliability (p)=Reliabilityis a measure of consistency/dependability, or when a test measures same thing more than once and results in same outcome. • Reliability refers to the consistency of examinees performance over repeated administrations of the same test or parallel forms of the test (Linda Crocker Text).
THE MODERN MODELS
Test-Retest • Class IQ Scores • Students X 1st time on MonY2nd time on Fri • John 125 120 • Jo 110 112 • Mary 130 128 • Kathy 122 120 • David 115120
Parallel/alternate Forms • Scores on 2 forms of stats tests • Students Form A Form B • John 95 92 • Jo 84 82 • Mary 90 88 • Kathy 76 80 • David 81 78
Test-Retest with Alternate Forms On Monday, you administer form A to 1st half of the group and form B to the second half.On Friday, you administer form B to 1st half of the group and form A to the 2nd half Students Form A to 1st group (Mon) Students Form B to 2nd group (Mon) David 85 Mark 82 Mary 94 Jane 95 Jo 78 George 80 John 81 Mona 80 Kathy 67 Maria 70 • Next slide
Test-Retest with Alternate Forms • On Friday, you administer form B to 1st half of the group and form A to the second Students Form B to 1st group (Fri) Students Form A to 2nd group (FRi) David 85 Mark 82 Mary 94 Jane 95 Jo 78 George 80 John 81 Mona 80 Kathy 67 Maria 70
HOW RELIABILITY IS MEASURED • Reliability is Measured by Using a • Correlation Coefficient • r test1•test2 or r x.y • Reliability Coefficients: • Indicates how scores on one test change, relative to scores on a second test • Can range from 0.0 to ±1 • ±1.00 = perfect reliability • 0.00 = no reliability
THE CLASSICAL MODEL
Method Error • ObservedScore = True Score ± ErrorScore • Trait Error • X=T±E A CONCEPTUAL DEFINITION OF RELIABILITYCLASSICAL MODEL
Classical Test Theory • The Observed Score, X=T+E • X is the score you actually record or observe on a test. • The True Score, T=X-E or, the difference between the Observed score and Error score is the True score • T score is the reflection of the examinee true knowledge • The Error Score, E =X-T or, the difference between the Observed score and True score is the Error score. • E are factors that cause the True Score and observed score to differ.
Method Error Observed Score = True Score ± Error Score Trait Error A CONCEPTUAL DEFINITION OF RELIABILITY • (X) Observed Score X=T±E • Score that actually observed • Consists of two components • True Score • Error Score
Method Error Observed Score = True Score ± Error Score Trait Error A CONCEPTUAL DEFINITION OF RELIABILITY • True Score T=X-E • Perfect reflection of true value for individual • Theoretical score
Method Error Observed Score = True Score ± Error Score Trait Error A CONCEPTUAL DEFINITION OF RELIABILITY • Method error is due to characteristics of thetest or testing situation • Trait error is due to individual characteristics • Conceptually, Reliability = • True Score • Observed Score • Reliability of the observed score becomes higher if error is reduced!! True Score True Score + Error Score
Method Error Observed Score = True Score ± Error Score Trait Error A CONCEPTUAL DEFINITION OF RELIABILITY OR • Error Score E=X-T • Is the Difference between Observed and True score ± • X=T±E • 95=90+5 or 85=90-5 The difference between T and Xis 5points or E=±5
The Classical True Score Model • X=T±E • X= Represents the observed test score • T= Represents the individual's True knowledge of score • E= Represents the random error component
Classical Test Theory • What Makes up the Error Score? E=X-T Error Score consist of; 1-Method Error and 2-Trait Error 1-Method Error Method Error is the difference between True & Observed Scores resulting from the test or testing situation. 2-Trait Error Trait Error is the difference between True & Observed Scores resulting from the characteristics of examinees. See next slide
Expected Value of True Score • Definition of the True Score • The True score is defined as the expected value of the examinees’ test scores (mean of observed scores) over many repeated testing with the same test.
Error Score • Definition of the Error Score • Error scores for an examinee over many repeated testing should be Zero. • eEj=Tj-Tj=0 • eEj=Expected value of Error • Tj=Examinee’ True Score Ex. next
Error Score • X-E=T or, the difference between the Observed score and Error score is the True score (scores are from the same examinee) 98-8= 90 88+2=90 80+10=90 100-10=90X±E=T 95-5=90 81+9=90 88+2=90 90-0=90 -8+2+10-10-5+9+2-0=0
*INCREASING THE RELIABILITY OF A TESTMeaning Decreasing Error7 Steps • 1. Increase Sample Size (n) • 2. Eliminate Unclear Questions • 3. Standardize Testing Conditions • 4. Moderate the Degree of Difficulty of the tests (P) • 5. Minimize the Effects of External Events • 6. Standardize Instructions (Directions) • 7. Maintain ConsistentScoring Procedures (use rubric)
How Reliability (p) is Measured for an Item/score • P=True Score/True Score + Error Score orp=T/T+E 0=== p === ±1 Note: In this formula you always add your Error(the difference between T and X) to the True Score in the denominator (±) , Whether is positive or negative. p=T/T + (the difference between T and X which is E) p=T/T+E
Which Item has the Highest Reliability?Maximum points for this question is 10p=T/T+E • +2= 8……….. 8/10=0.80 • -3=6…………. 6/9=0.666 • +7=1……….…1/8=0.125 • -1=9…………..9/10=0.90 • +4=6………....6/10=0.60 • -4=6……….....6/10=0.60 • +1=7………....7/8=0.875 • 0=10…………10/10=1.0 • -5=4…………..4/9=0.444 • +6=3…………..3/9=0.333 • >MORE ERROR <LESS RELIABLE