Download
1 / 20
200 likes | 206 Views
This chapter explores the synthesis challenges in biosystems control design, pharmaceutical operations, bioreactors, crystallizers, granulation, drug delivery, and diabetes, blood pressure, and cancer treatment. It also discusses the controlled treatment for HIV/AIDS and cardiac assist devices.

E N D
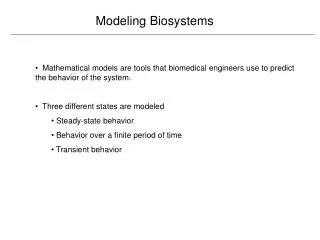
Chapter 23 addresses a variety of synthesis problems in the field of biosystems: • Biosystems Control Design • Pharmaceutical Operations • Bioreactors • Crystallizers • Granulation • Drug Delivery • Type 1 Diabetes • Blood Pressure Control • Cancer Treatment • Controlled Treatment for HIV/AIDS • Cardiac Assist Devices Chapter 23
Chapter 23 Figure 23.1 Schematic of a typical industrial fermentor.
Chapter 23 Figure 23.2 Step response of fermentor model to symmetric changes in dilution of magnitude 10% from the nominal value of D=0.202 h-1.
Chapter 23 Figure 23.3 Step response of fermentor model to symmetric changes in dilution of magnitude 10% from the nominal value of D=0.0389 h-1.
Chapter 23 Figure 23.4 Flowsheet of a typical industrial crystallizer showing concentration and temperature controllers, including cascade control for temperature.
Hierarchy of Process Information Need relationships between levels to deliver product which consistently meets the customers needs Plant operating variable trajectories and parameters Intrinsic process properties (MWD, CSD, PSD) Product performance properties (optical, flowability, dustiness) Chapter 23 Controllable, adjustable parameters Measurable, trackable, properties Customer requirements
Specific Challenges in Agglomeration Control • Various process operations • granulation • polymerization • spray drying • Common characteristics • real-time analysis required for distribution • complex heat/mass/momentum transfer problems • multiple attributes of interest (size, shape, concentration, etc.) • high dimension, stiff models • underactuated Chapter 23
Granulation Control – Challenges • Multivariable interactions (5th and 90th percentiles) • No target (setpoint) for 5th and 90th percentiles • One-sided limits • Data acquisition is difficult • Suggested Operating Objectives: • Track bulk density to reference • Minimize control effort if PSD within limits • Strong action if PSD out of limits Chapter 23
Chapter 23 Figure 23.5 Process flowsheet for granulation circuit with recycle.
Case Study[Pottman, Ogunnaike, Adetayo, and Ennis, Powder Tech., 1999] Oversized particles • Correlated Process Variables • particle size distribution (5th, 90th percentiles) • bulk density • Manipulated Variables • 3 spray nozzles (flow rate) [bounded] Spray nozzles Product Granulator Dryer Classifier Feed Chapter 23 Bulk density measurement Undersized particles
Chapter 23 Figure 23.6 Simplified process flowsheet for granulator example. Here u1, u2, u3 are, respectively, nozzles 1,2, and 3, and y1, y2, y3 are, respectively, bulk density, d5 and d90.
Chapter 23 Figure 23.7 Closed-loop response of granulator to +10 step change in set point for y1– left plot is outputs, right plot is inputs (dashed line, y1 and u1; dotted line, y2 and u2; dash-dot line, y3 and u3).
Chapter 23 Figure 23.8 Closed-loop response of granulator to +50 step change in set point for y1 with constraints enforced on the inputs. The left plot is outputs, right plot is inputs (dashed line, y1 and u1; dotted line, y2 and u2; dash-dot line, y3 and u3).
Diabetes Mellitus Chapter 23 • World’s most common and costly disease • About one in every 400 to 600 children and adolescents has type 1 diabetes mellitus (T1DM) National Diabetes Fact Sheet, 2005, Centers for Disease Control and Prevention • Complications of T1DM reduce life expectancy by ~15 years through micro- and macro-vascular disease • Heart disease and stroke • Blindness • Kidney disease • Nervous system disease • Evidence that intensive insulin therapy (IIT) reduces complications Diabetes Control and Complications Trial Research Group, 1993 • Increased hypoglycemic events with IIT Diabetes Control and Complications Trial Research Group, 1993
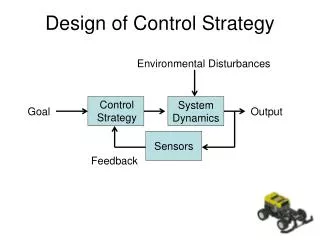
Model-Based Control Approach for Diabetes[Parker, Peppas, Doyle III, IEEE Trans Biomed. Eng. 1999] Model-based Algorithm Desired Glucose Level Insulin Glucose Patient Controller - Chapter 23 Model - Kalman Filter Compartmental Model Update Filter
Chapter 23 Figure 23.9 Block diagram for artificial b-cell, illustrating the meal as the most common disturbance. G denotes the blood sugar of the patient, Gm is the output of the glucose sensor, and Gsp is the glucose setpoint.
Chapter 23 Figure 23.10 Open-loop response of patient’s blood glucose when the insulin pump is turned off.
Chapter 23 Figure 23.11 Open-loop response of the patient’s blood glucose to a constant infusion rate of 15 mU/min from her insulin pump.
Chapter 23 Figure 23.12 Open-loop response of patient’s blood glucose to a constant infusion rate of 25 mU/min from her insulin pump.
Chapter 23 Figure 23.13 Closed-loop response of patient’s mean arterial blood pressure and cardiac output to a -10 mmHg change in the MAP set point.