Download
1 / 8
80 likes | 83 Views
Mercury in SF Bay The 8-Minute Conceptual Model. California Regional Water Quality Control Board San Francisco Bay Region. RMP Annual Meeting May 4, 2004 Richard Looker (rel@rb2.swrcb.ca.gov). 1. Mass budget. Mercury Discharges (Elemental and Inorganic). 3. Bioaccumulation.

E N D
Mercury in SF Bay The 8-Minute Conceptual Model California Regional Water Quality Control Board San Francisco Bay Region RMP Annual Meeting May 4, 2004 Richard Looker (rel@rb2.swrcb.ca.gov)
1. Mass budget Mercury Discharges (Elemental and Inorganic) 3. Bioaccumulation Methylating Regions-- Mercury in sediment 2.Transformations & Transport Bacteria in wetlands, mudflats and sloughs Methylmercury available for bioaccumulation The 30 Second Conceptual Model
1. Mass Budget ~ 10,000 kg Hg In Air Shed (20 km top) Outputs ~ 1700 kg/yr: ~ 100 kg Hg in Water Inputs ~ 1200 kg/yr: ~ 60,000 kg Hg in Active Sediment Active Sediment 15 cm • Significance and magnitude of loads? • Variability and Predictability of Loads? • Details of the active sediment layer?
2. Transformations & Transport Deposition Evasion Me-Hg in Fish Hg in Water Me-Hg in Water Import Export Me-Hg in Benthos Me-Hg in Sediment Hg in Sediment Active Sediment Erosion Burial • Where is methylation happening? (controlling factors?) • Transport details? (erosion, sediment movement?)
3. Bioaccumulation (Me-Hg concentrations shown relative to water) Eggs: 6000 200 Me-Hg in Water 1 ?? 3000 Me-Hg in Sediment 10 100-200 • What is the food web structure? • What are food web concentration patterns?
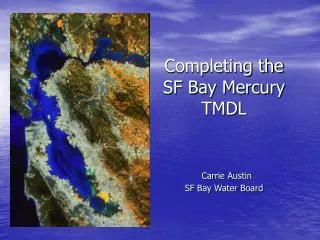
Wildlife and Fish Tissue are Indicators of Impairment • Too much Hg in fish • TMDL target is 0.2 ppm • Too much Hg in bird eggs • TMDL target < 0.5 ppm • Indicators for Management • Concentrations in small and large fish • Bird egg concentrations • Prey items for birds, fish • Sediment Me-Hg, Total Hg
What RMP Can/Could Do to Help • Gather risk management information (5 yrs.) • Fish consumption patterns among humans • Contamination patterns • Track food web concentrations (5 yrs.) • Track bird egg concentrations (5 yrs.) • Investigate significance of sources (5 yrs.) • Relative bioavailability (from chemistry) • Residence time issues (from transport) • Keep on sampling water, sediment, fish
What RMP Could Do To Help (but needs some help to do it) • Coordinate Hg-related research (ASAP) • Disseminate results • Ensure intercomparability of results • Ensure research addresses management needs There is currently no coordination between large number of research efforts. We will not have another chance like this in terms of resources so there is a desperate need to make the most of this opportunity.