Download
1 / 36
360 likes | 363 Views
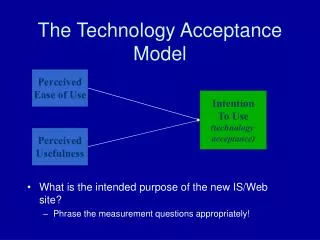
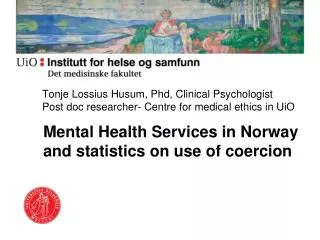
This presentation discusses the reasons for the lack of a valid measure for coercion, explores different instruments and techniques for measuring perceived coercion, and highlights some concerns and challenges in the field.

E N D
PERCEIVED COERCION WHY, WHAT & WHO HOW Georg Høyer Institute of community medicine University of Tromsø Holmen, March 5th 2011
?WHY • We still lack a valid measure for coercion • We still don’t know exactly what coercion is, how it shall be defined and eventually how to grade and measure coercion • Which again is why we lack knowledge about the effect of coercive interventions • There are reasons to believe that PERCEIVED COERCION is the most important element in this perspective, but also the most difficult to measure Holmen, March 5th 2011
“...What makes people feel coerced - is a prerequisite to understanding coercion as an independent variable (i.e., whether and how coerced hospitalization is effective in producing therapeutic outcomes)”Monahan et al. 1995 ?WHY Holmen, March 5th 2011
No-choice coercion (rotten choices) Structural coercion (ward rules etc) VIOLATION OF INTEGRITY AND/OR AUTONOMY HUMILIATION OTHER FACTORS FORMAL (LEGAL) COERCION ?WHAT WHAT CONSTITUTES COERCION? PROCEDURES PHYSICAL (CONCRETE) COERCION PERCEIVED COERCION Holmen, March 5th 2011
?HOW HOW CAN PERCEIVED COERCION BE EXPLORED? how Instruments/questionnaires Self-administered (Postal, on-site) Filled in by interviewer (Telephone, video, on-site) Global assessments vs structered, multidemential instruments Qualitative interviews Clinical interviews Holmen, March 5th 2011
?HOW MILESTONES IN THE EXPLORATION OF PERCEIVED COERCION how Late 1970th : First publications on patients’ experiences 1992: The MacArthur coercion study. Development of the AES and the MPCS 1997: Introduction of the Coercion Ladder (CL) Holmen, March 5th 2011
?HOW VARIOUS INSTRUMENTS 1978-1995: Mostly self-designed questionnaires, rarely used in more than one study 1995: The MacArthur Perceived Coercion Scale (MPCS), (Lidz et al, 1995) 1997: The Coercion Ladder (CL), (Høyer et al., 2002) 2001: The Community Perceived Coercion Scale, (Birmbaum, Lidz & Greenidge 2001) 2005: Psychiatric Experience Questionnaire (PEC), Frueh et al, 2005 2006: Perceived Coercion in Everyday Life (PCEL), (Steadman & Redlich, 2006) 2010: Coercion Experience Scale (CES), (Bergk, Flammer & Steinert, 2010) how Holmen, March 5th 2011
?HOW AES/MPCS how MPCS developed from a 104 item semistructured interview schedule, The Admission Experience Interview (AEI), through a 41 item questionnaire, The Admission Experience Survey, to a 15 (or 16) item version, The Admission Experience Scale, The AES The AES consists of 3-4 subscales (often given different names), one of them being the MPCS. Others are Voice (or “process exclusion”) (4 items), Negative pressures (or “Force/Threats”) (6 Items). Holmen, March 5th 2011
?HOW THE MACARTHUR PERCEIVED COERCION SCALE (MPCS-5) • (1) I had more influence than anyone else on whether I came into the hospital (Influence) • (4) I had a lot of control of whether I went into the Hospital (Control) • (7) I chose to come into the hospital (Choice) • (14) I felt free to do what I wanted about coming into the hospital (Freedom) • (15) It was my idea to come into the hospital (Idea) Holmen, March 5th 2011
?HOW MPCS-5: Some concerns • The definition of coercion: Coercion defined as lack of (or reduced) autonomy • The terms influence, control, choice and freedom (and idea) were chosen to constitute perceived coercionbecause it proved difficult to ask someone directly about coercion (The terms were chosen on basis of their face validity as everyday synonyms for autonomy) • If patients tells us that influence, control and the like, were absent, then coercion was present (Gardner et al 1993) Holmen, March 5th 2011
?HOW MPCS-5: Some concerns II • Validation problems (No ”Gold Standard”) • Studies on the reliability of perceived coercion measures almost non-existent • Low impact of the application of coercive measures on perceived coercion • Focus on the admission situation only (and does not discriminate between what happens in the community and at arrival to the hospital) • Cultural, socioecconomic, gender and race sensitive • Different scoring procedures (little discussed) (True/False, yes/no, Lickert score) Holmen, March 5th 2011
?HOW MPCS-5: Some concerns III Not very user friendly? % completion of AES/MPCS/CL AES MPCS CL 65.4 72.8 95.8 (The Nordic coercion study) Missing rate (%) for individual questions in MPCS: 1.6-11.8 Gardner et al. 1993: MPCS-5:11.8 %, but MPCS-4: 2.5-3.7 Nicholson et al. 1997: More than 20% refused to fill in the AES Holmen, March 5th 2011
1 (AES 3): 14.8 % 2 (AES 5): 14.8% 3 (AES 9): 22.2% 4 (AES 13): 12.9% COMBINED: INCONSISTENT: INCONSISTENT + MISSING ?HOW 51.9% 68.5% MPCS-5: Some concerns III Number of inconsistent answers when the four ”voice” questions were repeated during the same interview (%) (The Nordic coercion study, the Danish subsample) Low test-retest reliability (consistancy) Holmen, March 5th 2011
?HOW Perceved coercion: Other concerns Relations between Perceived Coercion and: Patient Satisfaction Humilation Violation of integrity Trauma Quality of Life Symmptom measures Holmen, March 5th 2011
WHAT DO WE KNOW ABOUT PERCEIVED COERCION? (MORE) WHAT There is a tendency that patients either feel coerced or not, and not a straight ”dose-effect” response in perceived coercion Holmen, March 5th 2011
MPCS-5 Scores THE NORDIC COERCION STUDY DISTRIBUTION OF MPCS SCORES Legally involuntary Legally voluntary Holmen, March 5th 2011
The Nordic Coercion StudyMean scores on the MPCS-5 MPCS ALL Vol Invol The Nordic Study 2.5 1.7 3.5 Bindman 2.6 1.9 3.4 Hoge (1978) - 0.6 3.2 Hiday (1997) 2.9 - - Holmen, March 5th 2011
WHAT MORE DO WE KNOW ABOUT PERCEIVED COERCION? (MORE) WHAT Gender, Age, Diagnosis, Degree of symptoms, Formal legal status, Number of previous admissions, are rarely associated with perceived coercion (with a few exceptions) Procedural justice/negative pressures/process exclusion/voice are the most important predictors of perceived coercion Surpirsingly low correspondence between use of physical coercion and perceived coercion Holmen, March 5th 2011
WHAT MORE DO WE KNOW ABOUT PERCEIVED COERCION II (MORE) WHAT Perceived coercion scores seem to be stable over time, even if more patients agree that the commitment was necessary as times go by More than half of the committed patients feel they have recieved help and have been treated well by the staff Holmen, March 5th 2011
?WHO Of course no-one, but our Honourable guest speaker Professor Chuck Lidz University of Massachutes Medical School, USA Holmen, March 5th 2011
PERCEIVED COERCION:SOME EMPIRICAL RESULTS VII What happened in the community before hospitalization was the best predictor of perceived coercion measured (> 2 days after admission) Cascardi & Poytress 1997 56.4 % af all committed patients said they would have accepted an offer to be admitted voluntarily Hoge et al, 1997 20-30 % of patients receiving ECT reported that they did not have the opportunity to say no even if this procedure required informed consent Rose et al, 2005 44% of voluntarily admitted patients beleived they would be formally detained if they tried to leave the ward Bindman et al, 2005 Holmen, March 5th 2011
PERCEIVED COERCION: SOME EMPIRICAL RESULTS VI: Restraint and perceived coercion 18 % of the committed patients had been subjected to physical coercion. However, the use of physical coercion was NOT significantly correlated to perceived coercion Iversen et al 2007 10 % subjected to physical force, low correlation to perceived coercion (0.27) Lidz et al, 1998 19/138 were subjected to restraint and 29/138 were secluded. Restraint was a significant predictor of high perceived coercion scores (p<0.02) McKenna et al, 1999 In other words: Surpirsingly low correspondence between use of physical coercion an Perceived coercion Holmen, March 5th 2011
PERCEIVED COERCION:SOME EMPIRICAL RESULTS II 50 % of involuntarily and 40 % of voluntarily admitted patients said their inetgrity had been violated Kjellin et al 1996 Holmen, March 5th 2011
PERCEIVED COERCION: SOME EMPIRICAL RESULTS VI: Accounts of being subjected to forced medication or restraint (%) Kjellin & Westrin 1998 Holmen, March 5th 2011
VALIDITET Innholdsvaliditet (content validity): Instrumentet (variabelen) må inneholde (alle) viktige faktorer av betydning for det man ønsker å måle, og variablene må ha et hensiktsmessig format Kriterievaliditet (Criterion validity): Korrelasjon mellom instrument (variabel) og gullstandard. Concurrent validity og predictive validity er begge varianter av kriterievaliditet Konstruksjonsvaliditet (construct validity):I hvilken grad sammenfaller resultatene instrumentet gir med empiri som ligger til grunn for den teoretiske konstruksjon av begrepet (fenomenet) vi vil undersøke. Må brukes når vi ikke har noen gullstandard Sitzia J. J for quality in health care 1999; 11(4):319-24 Holmen, March 5th 2011
Konstruksjonsvaliditet (construct validity) fortsatt: • Tre fremgangsmåter: • Korrelasjon mellom instrumentet og andre teoretiske og observerbare (målbare) mål for samme fenomen • Analyse av empiriske data for å se hvilke andre fenomen det aktuelle instrumentet korrelerer med • Anvende instrumentet for å se om det fungerer som forventet. • For eksempel skiller instrumentet klart mellom to grupper som • man ville forvente befant seg i hver enda av skalaen, dvs • instrumentets evne til å diskriminere • eller • Se på graden av korrelasjon mellom instrumentet og de • variablene det burde og burde ikke korrelere med • Sitzia J. J for quality in health care 1999; 11(4):319-24 Holmen, March 5th 2011
VALIDITET Intern validitet: Relaterer seg til tilfeldige feil, systematiske feil og confounding Ekstern validitet: Kan resultatene generaliseres og har de praktisk betydning? Bjørndal og Hofoss 2004 Holmen, March 5th 2011
1. (AES 1): 15 missing 2. (AES 4): 11missing 3. (AES 7): 9 missing 4. (AES 14): 24 missing 5. (AES 15): 27 missing AES-15: MPCS Number of questions answered: All five: 563 Four questions: 649 Three or less: 701 Holmen, March 5th 2011
PERCEIVED COERCION; PREDICTORS Model 1: AES-factors NOT included MPCS Legal status Own opinion of legal status Own idea to be admitted p<0.05R2= 0.26 COERCION LADDER Legal status Own opinion of legal status Offended during the admission Good to be admitted GAF p<0.05 R2= 0.22 Holmen, March 5th 2011
Perceived Coercion; PREDICTORS Model 2: AES-factors included (Linear regression, backwards) MPCS Negative pressures Process exclusion Own opinion of legal status Own idea to be admitted Necessary to be admitted p<0.05R2= 0.61 COERCION LADDER Negative pressures Process exclusion Own opinion of legal status BPRS-16 p<0.05 R2=0.61 Holmen, March 5th 2011
Low-High perceived coercion (MPCS 0-3 vs 4-5) Low-High perceived coercion (Ladder 1-4 vs 5-10) ORCI Own idea to be admitted 14.38 5.71-36.22 Negative Pressures 1.44 1.10-1.91 Process exclusion 2.30 1.66-3.19 ORCI Own idea to be admitted 3.90 1.72-8.87 Offended during 0.34 0.17-0.67 admission Negative Pressures 1.24 1.24-1.89 Process exclusion 1.27 1.27-2.08 The Nordic Coercion Studylogistic regression Holmen, March 5th 2011
AES-15 Holmen, March 5th 2011
Finland n=107 Norway n=96 Sweden n=133 Iceland n=114 % % % % 7.5 16.7 5.3 9.6 87.9 81.3 86.0 85.7 4.7 2.1 4.6 9.0 Legal status: voluntary The patients’ reports: Came to the hospital … Denmark n=47 % Involuntarily 12.8 Voluntarily 74.5 Neither/don’t know/no answer 12.8 Chi-Square = 16.91, df = 6, p = 0.010 Holmen, March 5th 2011
Denmark n=48 Finland n=122 Norway n=162 Iceland n=8 Sweden n=93 % % % % % 77.1 58.2 50.6 100 66.7 6.3 32.8 46.9 19.4 0 16.7 9.0 2.5 14.0 0 Legal status: involuntary The patients’ reports: Came to the hospital … Involuntarily Voluntarily Neither/don’t know/no answer Chi-Square = 45.25, df = 6, p = 0.000 Holmen, March 5th 2011
Interviewed Completed AES Completed MPCS(5) Completed CL Completed MPCS&CL Denmark 91 35 50 83 35 Finland 224 - - 204 - Iceland 131 94 99 128 93 Norway 253 214 228 250 213 Sweden 229 163 186 215 159 Total 928 506 563 880 500 The Nordic Coercion StudyStudy Sample Level 3 Holmen, March 5th 2011