Download
1 / 12
130 likes | 278 Views
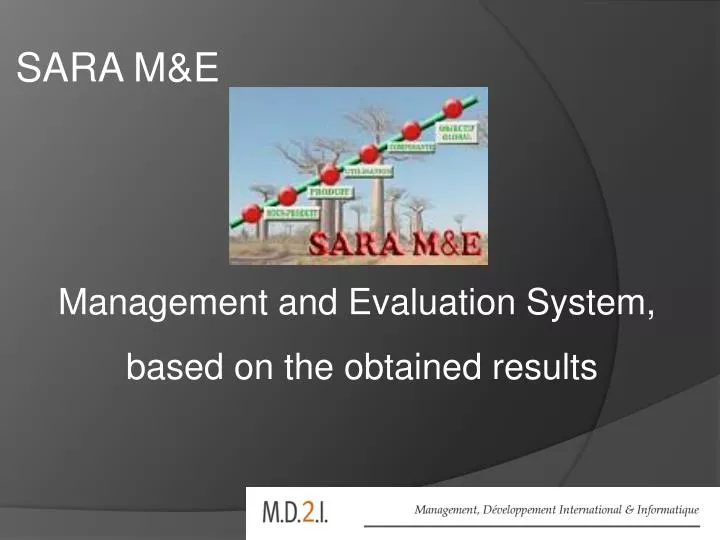
SARA M&E. Management and Evaluation System, based on the obtained results. Summary. SARA M&E monitors the progress of a project in terms of both its budget and its logical framework matrix.

E N D
SARA M&E Management and Evaluation System, based on the obtained results
Summary • SARA M&E monitors the progress of a project in terms of both its budget and its logical framework matrix. • This simple and intuitive web-based application can be used by a group of users (Team Leaders, Key Experts, Contracting Authorities, Beneficiaries and non state actors, Consortia, monitoring experts, etc), each of which can hold different, collaborative, and decentralised roles (review, addition/modification/ deletion of data, just reading, etc.). • All information is stored in a central database available over the internet, and can additionally be used locally or from a single workstation. • The monitoring of activities in SSE can be combined with automatic SMSs or emails early alerts. • The actors may communicate through the internet, by mail, SMS, Skype Google Apps, smartphone.
Summary (2) • We recommend SSE to be used as follows, with the support of MD2I, which developed the software : the Project Director will be responsible for entering the initial information into the system, after having finalised and defined: • - The logical framework - The impact and objectively verifiable indicators . • After this, a small training session will be provided to the users. The different roles and users for the management of M&E will be outlined. • The Team is usually responsible for entering the initial values of the IOV and the values sought for the activities, the budgets and impact indicators.
Summary (3) • Then, the system will contain a summary of • The initial information • The information regularly updated • The status extracts provided. • Initial Information • The baseline information of the financial agreement (title, amount, start and end dates, key experts, budget, etc.) • The logical framework • The overall objective, with its indicators & intended outcomes. • The specific objectives, their indicators, and intended outcomes (the indicators are qualitative or qualitative). • The expected results, their indicators and intended outcomes. • The activities planned for each result area. • The expected results appear on a map with the corresponding actor if it is the case (as the beneficiary Non state actor – NSA)
Summary (4) Progress of the project : • Degree to which the overall and specific objectives and the results have been achieved according to the status of their respective indicators. • Graphic demonstration for each result, available both to review on-screen or in an excel or pdf extract. • The system provides an overview, and can provide at any time, the remaining days to be spent by each category of expert as well as the remaining allocation for incidental expenditures. • M&E can be linked to the budget following-up software SARA, developed by MD2I in 35 countries.
Structure of the software Entering the data, in a collaborative way . Gathering the data on the spot and organizing the updating process when the user is web connected. Developing the automatic e-mail warning system to meet the delays. Data Analysis for the Reports and the Geographic information system GIS. Developing the warning sytems to obtain the expected results.
Method • The method used by SARA M&E is management based on the obtained results. • The data structure depends on the parameters asked by the client. Several levels of results may be foreseen. • The system includes a business plan ,data entry, and the required reports to think and to take action. • The data are managed through a business plan. They allow to calculate the impacts on the beneficiaries (short, medium and long term). • All the actors work and decide all together.
The resultsobtained by the sysrem • This is a sustainable system in the long term. • The obtained results are very easy to read. The user analyses the achievements compared to the expected results, this information will facilitate the project management. • To get a business plan and how to make it. • The business plan is regularly updated at several time scales: each week, year or more. • The users reach different information levels according to their reponsability in the project.
The main statements • The follow-up of the project is stated along three axes: • Indicators • Activities • Budgets (via SARA) • For the result indicators, M&E follows the obtained objectives compared to the purpose, at each result level. • The activities may have one of these three status: ongoing, achieved or cancelled.
Customizing the main statements • The reports are customized by MD2I. We only need the lay out of the required statement with the expected data for inserting the new output in SARA M&E. • MD2I is able to customize automaticaly tasks to inform the actors about the activities and the results obtained at each level. For example: • automatic mailing to the actors concerned each time a result change status; • automatic mailing of the operations planned to end soon (the next week, month …) • Automatic mailing of the operations too late. • ….
The main reports There are seven main reports : 1. The business plan, by period of time; 2. The activities for a specific period: ongoing, achieved, not achieved, cancelled; 3. The results obtained and the corresponding forecasts according to the logical framework. 4. The actual value of the indicators compared to the initial value and with the purpose; 5. The follow-up of the budget; 6. The comparison between what is done, the budget and the expenditures; 7. A Map of the project results (GIS)
Advantages of using M&E • The users have different roles (to add new entries, to delete, to modifying information, just as reader) • All the tasks are done collaboratively and decentrally. • All information are summarized in a central DB reached on the internet, through a local network or standalone. • The system is linked to • A geagraphic Information System (GIS) • And/or the SARA software (budget follow-up). • There are customized warnings (SMS or e-mail). • The Objectively verifiable indicators may be explained, if needed by joined documents. • The activity is planned and followed by agent.