Download
1 / 18
180 likes | 384 Views
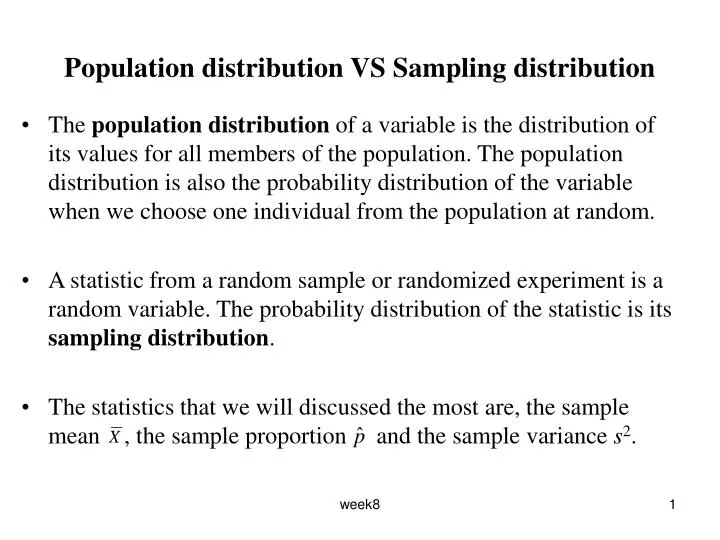
Population distribution VS Sampling distribution.

E N D
Population distribution VS Sampling distribution • The population distribution of a variable is the distribution of its values for all members of the population. The population distribution is also the probability distribution of the variable when we choose one individual from the population at random. • A statistic from a random sample or randomized experiment is a random variable. The probability distribution of the statistic is its sampling distribution. • The statistics that we will discussed the most are, the sample mean , the sample proportion and the sample variance s2. week8
Continuous random variables • A continuous r. v. X takes all values in an interval of numbers. • The probability distribution of X is described by a density curve. • The total area under a density curve is 1. • The probability of any event is the area under the density curve and above the value of X that make up the event. • Example The density function of a continuous r. v. X is given in the graph below. Find i) P(X < 7) ii) P(6 < X < 8) iii) P(X = 7) iv) P(5.5 < X < 7 or 8 < X < 9) week8
Normal distributions The density curves that are most familiar to us are the normal curves. week8
Normal approximation for counts and proportions • Draw a SRS of size n from a large population having population p of success. Let X be the count of success in the sample and the sample proportion of successes. When n is large, the sampling distributions of these statistics are approximately normal: X is approx. is approx. • As a rule of thumb, we will use this approximation for values of n and p that satisfy np ≥ 10 and n(1-p) ≥ 10 . week8
Example • You are planning a sample survey of small businesses in your area. You will choose a SRS of businesses listed in the telephone book's Yellow Pages. Experience shows that only about half the businesses you contact will respond. (a) If you contact 150 businesses, it is reasonable to use the Bin(150; 0.5) distribution for the number X who respond. Explain why. (b) What is the expected number (the mean) who will respond? (c) What is the probability that 70 or fewer will respond? (d) How large a sample must you take to increase the mean number of respondents to 100? week8
Exercise According to government data, 21% of American children under the age of six live in households with incomes less than the official poverty level. A study of learning in early childhood chooses a SRS of 300 children. (a) What is the mean number of children in the sample who come from poverty-level households? What is the standard deviation of this number? (b) Use the normal approximation to calculate the probability that at least 80 of the children in the sample live in poverty. Be sure to check that you can safely use the approximation. week8
Some useful results If X1 ~ N(μ1,σ1) , X2~ N(μ2,σ2) and X1 and X2 are independent then, X1 + X2 ~ and X1 - X2 ~ week8
Example The weight of the empty box has a normal distribution with mean 1kg and std. dev. 100g. The weight of its contents has a normal distribution with mean 12kg and std. dev. 1.34 kg, independently of the box. Find the probability that the total weight of the box and its contents will exceed 15kg. week8
Exercise Two friends Ty and Jed run a race. Jed is a faster runner and the time he takes to complete the race is normally distributed with mean 3 minutes and std. dev. 30 sec. Ty’s time to complete the race is normally distributed with mean 5 minutes and std. dev. 1 minute. Find the probability that Ty will win the race. week8
The mean and the std. dev. of the sample mean • Select a SRS of size n from a population and measure a variable X on each individual in the sample. • The data consists of observations on n r.v’s X1,X2…,Xn. • If the population is large we can consider X1,X2…,Xn to be independent. • The sample mean of a SRS of size n is . • If the population has mean and std dev. , what is the: • mean of the total T = X1+X2+···+Xn ? Answer: μT = μ X1+X2+···+Xn = n·μ week8
Mean of the sample mean ? • Variance of the total T ? • Variance of the sample mean? week8
Sampling distribution of a sample mean • If a population has the N(,) distribution, then the sample mean of n independent observations has the N(, / ) • Example A bottling company uses a filling machine to fill plastic bottles with a popular cola. The bottles are supposed to contain 300 milliliters (ml). In fact, the contents vary according to a normal distribution with mean 298 ml and standard deviation 3 ml. (a) What is the probability that an individual bottle contains less than 295 ml? (b) What is the probability that the mean contents of the bottles in a six-pack is less than 295ml? . week8
The central limit theorem • Draw a SRS of size n from a population with mean and std dev. . When n is large, sampling distribution of a sample mean is approximately normal with mean and std dev. / . • Note: The normal approximation for the sample proportion and counts is an important example of the central limit theorem. • Note: The total T = X1+X2+···+Xn is approximately normal with mean n and stdev. ·. week8
Example (Question 24 Final Dec 98) Suppose that the weights of airline passengers are known to have a distribution with a mean of 75kg and a std. dev. of 10kg. A certain plane has a passenger weight capacity of 7700kg. What is the probability that a flight of 100 passengers will exceed the capacity? week8
Example In a certain University, the course STA100 has tutorials of size 40. The course STA200 has tutorials of size 25, and the course STA300 has tutorials of size 15. Each course has 5 tutorials per year. Students are enrolled by computer one by one into tutorials. Assume that each student being enrolled by computer may be considered a random selection from a very big group of people wherein there is a 50-50 male to female sex ratio. Which of the following statements is true? A) Over the years STA100 will have more tutorials with 2/3 females (or more). B) Over the years STA200 will have more tutorials with 2/3 females (or more). C) Over the years STA300 will have more tutorials with 2/3 females (or more). D) Over the years, each course will have about the same number of tutorials with 2/3 females (or more). E) No course will have tutorials with 2/3 females (or more). week8
Question State whether the following statements are true or false. (i) As the sample size increases, the mean of the sampling distribution of the sample mean decreases. (ii) As the sample size increases, the standard deviation of the sampling distribution of the sample mean decreases. (iii) The mean of a random sample of size 4 from a negatively skewed distribution is approximately normally distributed. (iv) The distribution of the proportion of successes in a sufficiently large sample is approximately normal with mean p and standard deviation where p is the population proportion and n is the sample size. (v) If is the mean of a simple random sample of size 9 from N(500, 18) distribution, then has a normal distribution with mean 500 and variance 36. week8
Question State whether the following statements are true or false. • A large sample from a skewed population will have an approximately normal shaped histogram. • The mean of a population will be normally distributed if the population is quite large. • The average blood cholesterol level recorded in a SRS of 100 students from a large population will be approximately normally distributed. • The proportion of people with incomes over $200 000, in a SRS of 10 people, selected from all Canadian income tax filers will be approximately normal. week8
Exercise A parking lot is patrolled twice a day (morning and afternoon). In the morning, the chance that any particular spot has an illegally parked car is 0.02. If the spot contained a car that was ticketed in the morning, the probability the spot is also ticketed in the afternoon is 0.1. If the spot was not ticketed in the morning, there is a 0.005 chance the spot is ticketed in the afternoon. a) Suppose tickets cost $10. What is the expected value of the tickets for a single spot in the parking lot. b) Suppose the lot contains 400 spots. What is the distribution of the value of the tickets for a day? c) What is the probability that more than $200 worth of tickets are written in a day? week8