Download
1 / 29
290 likes | 393 Views
The Serpens Star Forming Region in HCO + , HCN, and N 2 H +. Michiel R. Hogerheijde Steward Observatory The University of Arizona. Outline. Molecular clouds and star formation The Serpens star-forming region Single-dish images Interferometer images

E N D
The Serpens Star Forming Region in HCO+, HCN, and N2H+ Michiel R. Hogerheijde Steward Observatory The University of Arizona
Outline • Molecular clouds and star formation • The Serpens star-forming region • Single-dish images • Interferometer images • Combination single-dish and interferometer • Abundances • A shock model for HCN and N2H+ • Conclusions
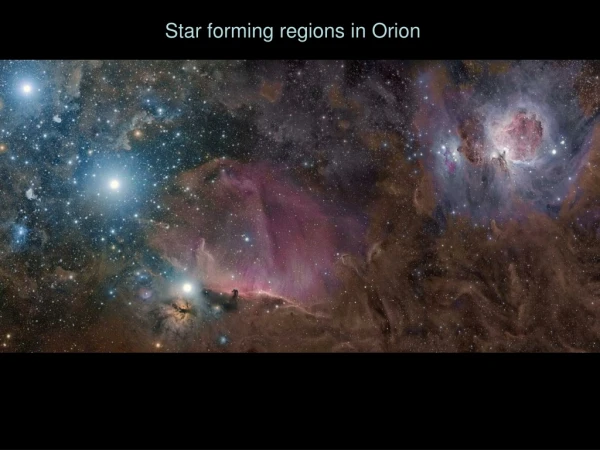
Molecular clouds and star formation • Stars form in condensations in interstellar clouds • Cloud structure determines stellar masses • Jets, outflows affect cloud chemistry and structure
The Serpens star-forming region • Dense cluster of pre–main-sequence stars • Two condensations, NW and SE • ~Dozen submm continuum peaks • Many associated with YSOs, some starless cores SCUBA 850 µm on DSS image Davis et al. (1999)
SMM5 SMM9/ S68N SMM8 SMM10 SMM1/ FIRS1 SMM3 SMM6 SMM4 SMM2 SMM11 JCMT/SCUBA images of Serpens Davis et al. (1999)
Many outflows ‘Tangle’ of outflows Intermediatevelocities: ±7 km s-1 Extreme velocities: ±11 km s-1 Davis et al. (1999)
How do outflows affect structure and chemistry in Serpens? • J=1–0 transitions (≈3 mm) of HCO+, HCN, N2H+ • Common tracers of dense [n(H2)≈105–6 cm-3] and cool (Tkin≈30 K) gas • Morphology chemistry • Single-dish on-the-fly maps from Kitt Peak 12-meter telescope • Interferometer mosaics from the Berkeley-Illinois-Maryland array (SE region only)
Single-dish maps Resolution 1 = 0.12 pc = 21,000 AU HCO+ 1–0 HCN 1–0 N2H+ 1–0
Single-dish maps • N2H+ equally strong in NE and SE • Follows submillimeter continuum • HCO+ and HCN peak in SE • Where most embedded YSOs and their outflows are • E-W velocity gradient • Solid-body rotation, also noted by Olmi & Testi (2002)
Interferometer mosaics • Higher resolution: 10–20 arcsec; 140 arcsecs primary field of view • Filters out large-scale emission ~ 115 arcsec • 13-point ‘mosaic’: overlapping pointings
Interferometer mosaics: N2H+ Resolution 17 = 0.033 pc = 7000 AU
Interferometer mosaics: N2H+ Color: N2H+ Contours: 850 µm
Interferometer mosaics: HCN Resolution 21 = 0.041 pc = 8500 AU
Interferometer mosaics: HCO+ Resolution 12 = 0.022 pc = 4600 AU
Interferometer mosaics • N2H+: • At continuum peaks • Ahead of SMM3’s jet • North of ‘shock position’ • HCO+ and HCN: • near YSOs, outflows • Strong blue-shifted HCN west of SMM4: • ‘shock position’
Combining single-dish and interferometer data • Interferometers filter out emission on scales larger ~ shortest antenna spacing • Missing ‘zero-spacing’ flux • KP12m well matched to 6-m BIMA antennas • Method: joint deconvolution
Combined BIMA and KP12m • Combined maps qualitatively look as expected • High resolution of BIMA brings out velocity details on small scales • ‘Washed out’ in KP12m map • BIMA recovers ~30% of line flux
Abundances • Are HCO+ and HCN enhanced by outflow action? • Throughout core, or only locally?
Abundances • Olmi & Testi (2002) • C18O 1–0 map • FCRAO: 1 arcmin resolution • Tex • N(H2) • Use to derive abundances on 1 arcmin scales
Abundances HCO+ HCN N2H+
Factor 2 enhancement near YSOs (outflows) Abundances HCN, HCO+<< dark clouds: depletion; Tex? Abundances a) van Dishoeck et al. 1993; Ohishi et al. 1992; Turner 2000
Shock model for HCN and N2H+ SMM3’s jet Shock position • Offsets between HCN (color) and N2H+ (contours)
Shock model for HCN and N2H+ • C-type shock • Magnetic precursor • Ions accelerate, compress, and heat before neutrals • N2H+emission up in precursor • HCN abundance up in warm region: evaporation of ices • Accompanying H2O destroys N2H+ Draine & Katz (1986)
Two models for shock position: 1 • Jet driven by SMM4, deflected by dense material. N2H+ in magnetic precursor of C-type shock.
Two models for shock position: 2 • Jet driven by SMM1, hitting dense matter. HCN at bow shock, N2H+ along the sides where shock speeds are lower.
Conclusions • HCN, HCO+ locally enhanced by shocks • Depleted in rest of cloud compared to dark-cloud values • Unresolved observations would trace outflow-affected material preferrentially • N2H+ undepleted: traces condensations • N2H+ emission ahead of shocks: enhancement in magnetic precursor, destruction in warm region?
Future work • C18O on 10–20 arcsec scales, fully sampled • Higher-J lines: excitation HCN, HCO+, and N2H+ • High-resolution interferometry shock region; additional species • Time-dependent shock-chemistry model
Many thanks to… • Staff of the Kitt Peak 12 meter Radio Telescope • Staff of the Berkeley-Illinois-Maryland Association millimeter array • Chris Davis and Luca Olmi for making their data available electronically