Download
1 / 22
220 likes | 375 Views
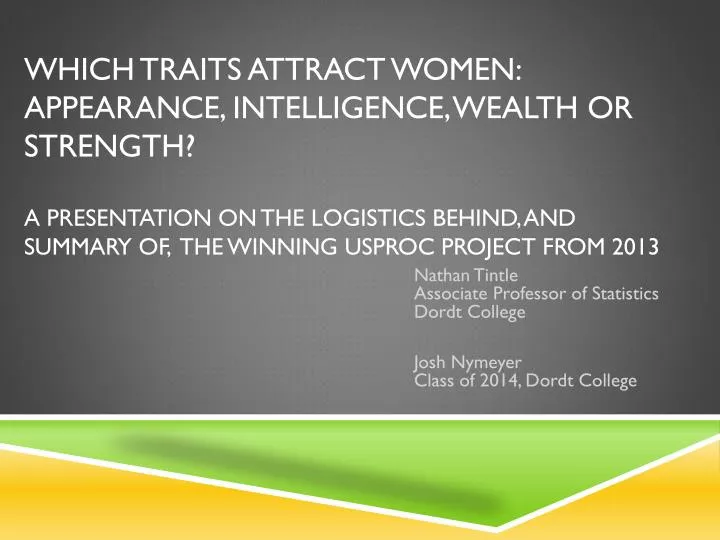
Which traits attract women: Appearance, Intelligence, Wealth or Strength? A presentation on the logistics behind, and summary of, the winning USPROC project from 2013. Nathan Tintle Associate Professor of Statistics Dordt College Josh Nymeyer Class of 2014, Dordt College. Overview. Nathan

E N D
Which traits attract women: Appearance, Intelligence, Wealth or Strength?A presentation on the logistics behind, and summary of, the winning USPROC project from 2013 Nathan TintleAssociate Professor of StatisticsDordt College Josh NymeyerClass of 2014, Dordt College
Overview • Nathan • An overview of stat ed to get where we are today • A model for a second course in Statistics • Integrating a national project competition; future of USPROC • Josh • An overview of the winning project • Time for questions
background • Where we’ve been—consensus Stat 101 curriculum; Birth of Stat Ed; GAISE • Where we are • Embracing GAISE Pedagogy • Societal changes (ExpertData) • Research changes (Switzer and Horton) • Terminal Stat 101 course • Cobb challenge • Where we’re headed • Incremental content change in first course • Breaking down barriers to entry to the second course (Mult regression, ANCOVA, ANOVA, General Linear Models)—Theme “What is a statistical model and how do you use it?” • Books: Stat 2 (Cannon et al.), Kuiper and Sklar, Ramsey and Schafer
Our approach to stat ed • Two versions of a first course • Both use randomization/simulation (see http://math.hope.edu/isi) for details of curriculum • One is regular, full semester (16 weeks, 3 hours p/week) course (3 credits) • Other is accelerated ½ semester (8 weeks, first half of semester) course for students who’ve (a) had substantial math (e.g., Calculus—but we don’t use calculus!) or (b) Had prior experience with stats (e.g., AP Statistics or other HS course in statistics) (2 credits) • The course is identical to the regular full length version EXCEPT is goes twice as fast; learning outcomes are the same • We attempt to place students into the correct place based on their background • This replaced the traditional “calculus based” statistics course
Our approach to stat ed • Second course • ½ semester (2nd half); 4 hours p/week; 2 credits • Immediately follows accelerated first course • Students place into it by successfully completing EITHER first course
Our approach to stat ed • Content and Pedagogy • A full description can be found here: • Challenging the State of the Art in Post-Introductory Statistics: Preparation, Concepts, and Pedagogy (Talk/paper at ISI/IASE, Hong Kong, August 2013)http://www.statistics.gov.hk/wsc/IPS032-P1-S.pdf • Outcomes: Multiple regression models; general linear models; logistic regression • Approach: Hands-on, discovery pedagogy, judicious use of simulation; Emphasis on big ideas of CONFOUNDING and UNWANTED VARIABILITY • Instead of letting models be the goal, models are a means to an end, not an end in and of themselves • How can design and analysis strategies account for unwanted and/or previously unexplained variation? • How can confounding variables be controlled by design and analysis?
Our approach to stat ed • Projects in second course • Two projects • Service learning---work with an on or off-campus client to apply a multiple regression/general linear model to their data (Data already collected; observational) • The client drives research questions • I pre-screen (collect topics all year when people knock on my door!) • Oral poster presentation at undergraduate research conference on campus • Multi-factor experiment with blocking • Student designed; must have at least 3 factors and at least one blocking variable • One page proposal; Oral presentation in class (feedback); Final written report (peer-reviewed journal article format), appendix of details and dataset
USPROC • Biennieal (may be changing!) national competition • Two tracks: Class projects and undergraduate research projects • Told students part of their final exam (50 out of 200 points) was for submitting one of their two projects to USPROC • Reformatting; addressing my feedback; I gave a few pointers on how to give a bit more detail on some things for stat prof’s vs. students in a class, but fairly “ready to go” from class • Josh will now share with you his winning project, after which time for questions about class, his project, USPROC, etc!
Which Traits Attract Women: Appearance, Intelligence, Wealth, or Strength?
Background • Men have always wondered what women find attractive • One study suggests intelligence attracts women (Moore et. al) • This study manipulated intelligence through change in physical appearance, rather than a written description • As single, intelligent men we wanted to look into this hypothesis • Our goal was to see if intelligence, wealth, appearance, or strength had a significant impact on level of attractiveness to women at a small college • Null Hypothesis: There is no relationship between intelligence, wealth, appearance, or strength and attractiveness
Methods • Variables • Explanatory: Strength, Wealth, Intelligence, Appearance • All treated as indicator variables when conducting analysis • Blocking: Age (Split into upper and underclassmen) • Response: Attractiveness Rating • Quantitative Variable • Study Design • Designed a hypothetical dating survey complete with picture, description, and attractiveness scale • Description was altered to include indicators of strength, intelligence, wealth, or a combination of these attributes • Created a 2^4 factorial design with a single dichotomous blocking variable. Our sample size was 64, meaning we had two individuals in each treatment-block group • Participants were asked to rate the attractiveness of the man in the profile they viewed
Survey • Participants were given a survey containing: instructions, brief profile, a rating scale, and a photo, These are shown in the following slides. • Instructions: Imagine you are participating in an online dating service and the service has returned a "match" to you based on personality, characteristics, spirituality and general likes/dislikes. You have now received a brief paragraph description of a guy-- who has expressed an interest in going out on a first date with you. Based on the information provided (picture and brief bio) how attractive do you find this potential suitor?
Survey Below is an example of the profile listed on the survey. This particular profile contained all three indicator sentences. Each profile was also accompanied by a picture (shown on next slide). Hi my name is Kenny Smith. I am twenty years old and I attend ***** College, but I am from Colorado Springs, Colorado. I have two siblings that I am close to. I enjoy hanging out with friends and many other activities. Donut runs late at night are one of the things I especially enjoy. My roommates enjoy going out with me, not just because I’m a good time, but because I’m often willing to foot the bill. I’ve got to spend my inheritance somewhere!One reason I choose to attend ***** is the athletic scholarship I received. This requires a sizable time commitment between practice and workouts, but it is something I really enjoy. Despite the fact school has always come naturally to me, I do reserve some time for studying. Getting good grades is something that is important to me. I would love to get to know you better. If you are interested please contact me at knnysmth@*****.edu Wealth Indicator Sentence Strength Indicator Sentence Intelligence Indicator Sentence Note: Indicator sentences were not colored for the experiment, done here for illustrative purposes. The college name has also been removed For profiles in which a variable had a value of zero, the correlating indicator sentence was omitted from the bio.
Attractiveness Scale &Appearance Variable A 9 point rating scale was used to measure participants’ perceived attractiveness of the hypothetical man. Unattractive Photo Attractive Photo
Analysis • Analyzed data with a Univariate Linear Model • SPSS used to build a custom model • Began by adding all 5 variables: Appearance, Intelligence, Wealth, Strength, and Class as main effects in model • All 4-way, 3-way, and 2-way interactions were added to model • Performed Backwards Stepwise Regression on Interactions • Linear model run and 4-way interaction determined insignificant • 3-way interactions eliminated one by one beginning with interaction that had the highest p-value (least significant) • 2-way interactions eliminated one by one beginning with interaction that had the highest p-value (least significant)
Analysis Results • One significant 2-way interaction was found: Wealth and Intelligence • P-Value of .052 • Significance level set at 10% • Low enough to indicate significance in exploratory study (Small Sample Size) • A coefficient of -1.250 indicated a significant difference in attractiveness • Intelligence without wealth increased attractiveness by .75 • Intelligence with wealth decreased attractiveness by .5
The best combination of traits is to be intelligent and not wealthy. Surprisingly, the worst combination of attributes was to be both wealthy and intelligent. We attribute this to the “Too Good to be True” Effect. A man who is both rich and intelligent is off-putting to women. Interaction between wealth and Intelligence We have sufficient evidence (at the 10% level) to reject the null hypothesis that there is no interaction between wealth and intelligence: i.e. Effect of Wealth with Intelligence is equal to the Effect of Wealth without Intelligence
Analysis Results • In addition to the one significant two-way interaction, one of the other experimental factors was significant with a p-value of 0.035 . • Single factors tested for significance using Backwards Stepwise Elimination • All five variables included in Univariate Linear Model • Analysis run, and variable with highest p-value (least significance) eliminated • All variables eliminated until only Appearance remained as significant • Appearance determined to be significant at 5% level • Appearance has a significant effect on attractiveness, regardless of other factors • Coefficient of 0.688 indicated a score increase of 0.688 when the attractive picture was used, regardless of values of other variables
Conclusions • One Interaction determined to be significant at 10% level • Wealth and Intelligence have a significant interaction on attractiveness rating • Having one or the other increased attractiveness over having neither • The presence of both wealth and intelligence had a negative impact of attractiveness score. We refer to this phenomenon as the “Too Good to be True” effect • One single variable determined to be significant at 5% level • Appearance had a positive effect on attractiveness, regardless of other variables • Regression Equation: • Score = 6.5 + .688*Appearance + .625*Wealth + .75*Intelligence - 1.25*Wealth*Intelligence
Conclusions (cont) • “Too Good to be True” Effect • It is possible too have too much of a good thing, the presence of both wealth and intelligence had a negative effect, contrary to our intuition • We hypothesized the presence of these two traits made the hypothetical man seem unattainable, he was perceived as being too good to try and date • We would like to explore this effect further through more experimentation. The next step would be to create an experiment where the only variables are wealth, intelligence, and appearance. Testing the interaction of wealth and intelligence on a larger number of picutres would help determine if this is a general principle, or a phenomenon specific to these two photos • Broader Implications • Due to the study design, we should be careful about generalizing our findings to the entire population of female students at this college • Further experiments, such as the one suggested above, could give us a better idea if these results can be generalized to the whole population, or are unique to this sample
Limitations • Study Design • It was difficult to indicate the presence of various non-physical traits through a paragraph in a clear yet subtle manner • Sampling • A convenience sample was used rather than a random sample, so we must be very careful about generalizing results to the population of all female students at this college • A rather small sample size was used in this survey, giving us less accurate data with which to run our analysis • Survey • The attitude of survey takers can have a significant impact on results. We faced some difficulty with participants who had little interest or concern for the survey • Another limitation of the survey is that 5 (the middle) value was a very common rating in survey responses. This could be addressed by using a ten point rating scale; however, we feel there would still be significant bunching around the middle of the scale
References Moore, F. R., Filippou., D. D., & Perrett, D. I. (2011). Intelligence and attractiveness in the face: Beyond the attractiveness halo effect. Journal Of Evolutionary Psychology, 9(3), 205-217. doi:10.1556/JEP.9.2011.3.2