Download
1 / 16
170 likes | 412 Views
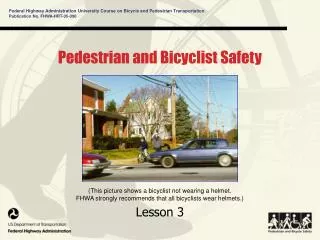
Publication No. FHWA-HRT-05-090 . Pedestrian and Bicyclist Safety. (This picture shows a bicyclist not wearing a helmet. FHWA strongly recommends that all bicyclists wear helmets.). Lesson 3. Lesson Outline. How is a crash different from an accident? Pedestrian and bicycle crashes: Number.

E N D
Publication No. FHWA-HRT-05-090 Pedestrian and Bicyclist Safety (This picture shows a bicyclist not wearing a helmet. FHWA strongly recommends that all bicyclists wear helmets.) Lesson 3
Lesson Outline • How is a crash different from an accident? • Pedestrian and bicycle crashes: • Number. • Characteristics. • Types.
Lesson Outline • Pedestrian and Bicycle Crash Tool (PBCAT). • Crash frequency using geographic information systems (GIS). • Crash countermeasures. • Benefit-cost analysis.
Magnitude of the Problem • In 2003: • 4,749 pedestrians were killed. • 622 bicyclists were killed. • Bike/pedestrian crashes accounted for 13% of all highway fatalities. • There were 70,000 urban pedestrian injuries. • There were 46,000 urban bicyclist injuries.
Pedestrian Crash Characteristics • Young people are overrepresented. • 33% of all crashes result in serious injury or death. • Alcohol or drugs are involved in about 15% of all crashes. • Crashes most often occur during late afternoon or early evening hours.
Pedestrian Crash Characteristics • About 2/3 of all crashes occur in urban areas. • 69% of fatal pedestrian crashes occur at nonintersection locations. • Most injury crashes occur at intersections. • Pedestrians were solely at fault in 43% of crashes. • Drivers were solely at fault in 35% of crashes.
Bicycle Crash Characteristics • About 3/4 of all crashes occur at nonintersection locations. • Young people are overrepresented. • 18% of bicycle-motor vehicle crashes result in serious injuries or death.
Bicycle Crash Characteristics • Crashes most often occur during late afternoon or early evening. • About 2/3 of all fatal crashes occur in urban areas. • Bicyclists were solely at fault in 50% of the crashes. • Younger bicyclists were at fault more often than drivers. • 36% of crashes are parallel path collisions. • 57% of crashes are crossing path collisions.
Crash Type Countermeasures • Sidewalks. • Crosswalks. • Bike lanes. • Education. • Small curb radii. • Chokers. • Pedestrian crossing islands. • Speed humps versus speed tables. • Full and partial street closures.
Crash Typing and Frequency Analysis • PBCAT: • Q&A-based crash typing. • Suggested countermeasure. • GIS: • Hot spot analysis. • Relational aspects. Source: HGAC http://www.h-gac.com
GIS Crash Frequency Analysis Source: HGAC http://www.h-gac.com
Benefit-Cost Analysis • Safety improvement index: • Benefit-cost used to rank different projects. • Benefit-cost ratio: • Reduction in crash cost (benefit). • Expected countermeasure cost. • Three years of crash data. • Projected traffic volumes. • Service life of project.
Lesson Summary • Bicycle and pedestrian crashes are preventable. • Bicycle and pedestrian crashes account for a significant portion of the highway safety problem in the United States. • The types of crashes that occur and the characteristics of these crashes make prevention a more attainable goal.
Lesson Summary • Many tools are available to assist in crash analysis. • Crashes and countermeasures have associated costs. • Safety improvement index or benefit-cost analysis can be used to rank safety projects.