Download
1 / 22
220 likes | 352 Views
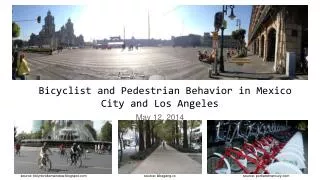
2. Overview of presentation. Fatal traffic crashes State/national comparisons (CDC data)Overall data (FARS) Trends, county comparisonsContributing factors: speeding, alcohol use, helmets, time, Non-fatal traffic crashes County comparisons, trends, age, contributing factorsMVAR/DOT crash data

E N D
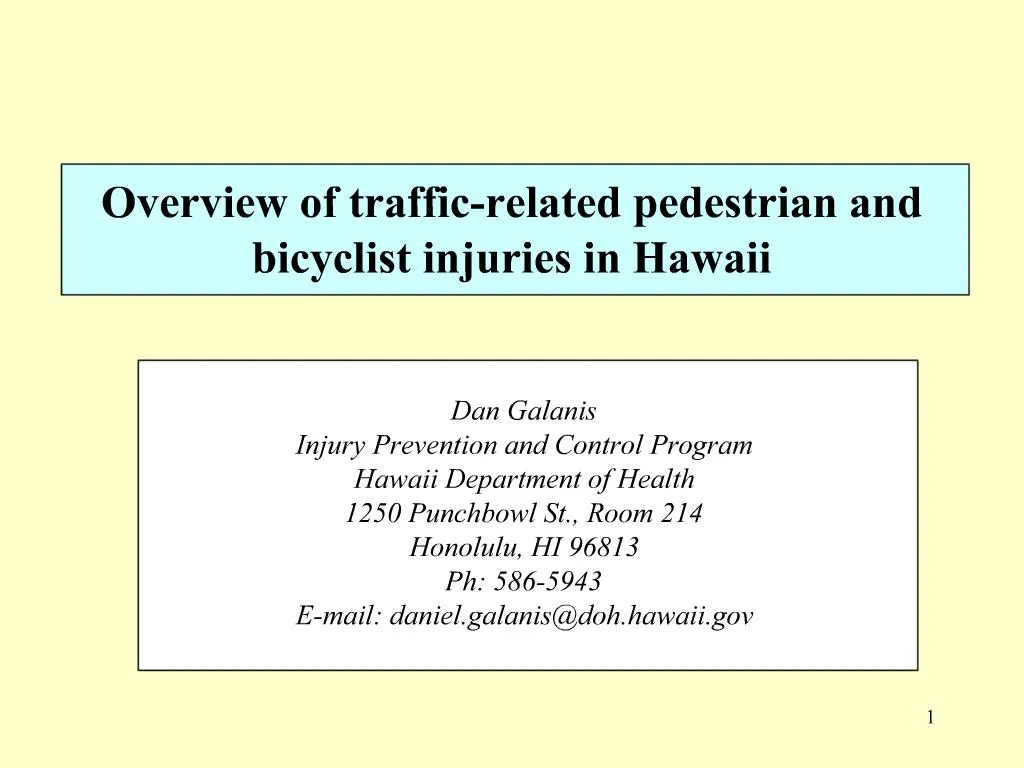
1. 1 Overview of traffic-related pedestrian and bicyclist injuries in Hawaii
Dan Galanis
Injury Prevention and Control Program
Hawaii Department of Health
1250 Punchbowl St., Room 214
Honolulu, HI 96813
Ph: 586-5943
E-mail: daniel.galanis@doh.hawaii.gov
2. 2 Overview of presentation Fatal traffic crashes State/national comparisons (CDC data) Overall data (FARS) Trends, county comparisons Contributing factors: speeding, alcohol use, helmets, time, Non-fatal traffic crashes County comparisons, trends, age, contributing factors MVAR/DOT crash data Descriptions of injuries Hospital and emergency department (ED) records