Download
1 / 1
20 likes | 194 Views
Band 119 Mid-point 2.3 µm. Band 77 Mid-point 1.5 µm. Band 28 Mid-point 0.83 µm. Band 16 Mid-point 0.65 µm. C 3. The ground truth data was collected from urban and forest area. Band 10 Mid-point 0.56 µm. C 2. C 1. Percentage membership of Tree Fraction for Ash

E N D
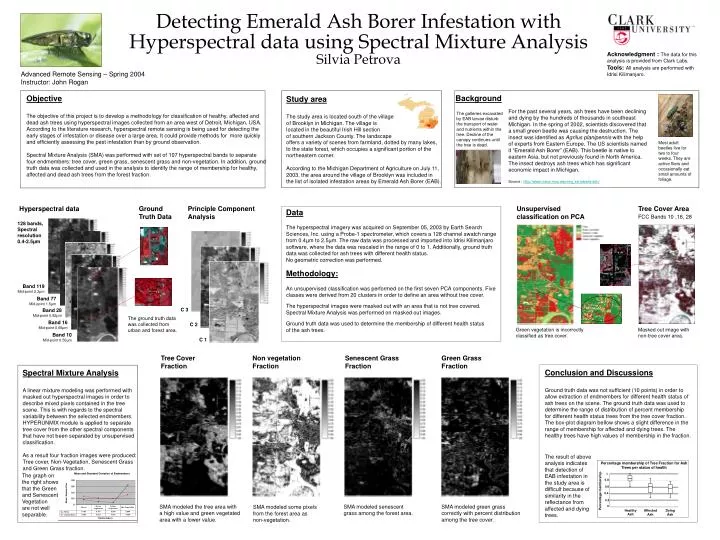
Band 119 Mid-point 2.3µm Band 77 Mid-point 1.5µm Band 28 Mid-point 0.83µm Band 16 Mid-point 0.65µm C 3 The ground truth data was collected from urban and forest area. Band 10 Mid-point 0.56µm C 2 C 1 Percentage membership of Tree Fraction for Ash Trees per status of health 1 0.8 0.6 Percentage membership 0.4 0.2 0 Healthy Ash Affected Ash Dying Ash Acknowledgment :The data for this analysis is provided from Clark Labs. Tools:All analysis are performed with Idrisi Kilimanjaro. Advanced Remote Sensing – Spring 2004Instructor: John Rogan Detecting Emerald Ash Borer Infestation with Hyperspectral data using Spectral Mixture AnalysisSilvia Petrova For the past several years, ash trees have been declining and dying by the hundreds of thousands in southeast Michigan. In the spring of 2002, scientists discovered that a small green beetle was causing the destruction. The insect was identified as Agrilus planipennis with the help of experts from Eastern Europe. The US scientists named it “Emerald Ash Borer” (EAB). This beetle is native to eastern Asia, but not previously found in North America. The insect destroys ash trees which has significant economic impact in Michigan. Source : http://www.msue.msu.edu/reg_se/roberts/ash/ Background Objective The objective of this project is to develop a methodology for classification of healthy, affected and dead ash trees using hyperspectral images collected from an area west of Detroit, Michigan, USA. According to the literature research, hyperspectral remote sensing is being used for detecting the early stages of infestation or disease over a large area. It could provide methods for more quickly and efficiently assessing the pest infestation than by ground observation. Spectral Mixture Analysis (SMA) was performed with set of 107 hyperspectral bands to separate four endmembers: tree cover, green grass, senescent grass and non-vegetation. In addition, ground truth data was collected and used in the analysis to identify the range of membership for healthy, affected and dead ash trees from the forest fraction. Study area The study area is located south of the village of Brooklyn in Michigan. The village is located in the beautiful Irish Hill section of southern Jackson County. The landscape The galleries excavated by EAB larvae disturb the transport of water and nutrients within the tree. Decline of the canopy continues until the tree is dead. offers a variety of scenes from farmland, dotted by many lakes, to the state forest, which occupies a significant portion of the northeastern corner. According to the Michigan Department of Agriculture on July 11, 2003, the area around the village of Brooklyn was included in the list of isolated infestation areas by Emerald Ash Borer (EAB). Most adult beetles live for two to four weeks. They are active fliers and occasionally eat small amounts of foliage. Hyperspectral data Ground Truth Data Principle Component Analysis Tree Cover Area FCC Bands 10 ,16, 28 Unsupervised classification on PCA Data The hyperspectral imagery was acquired on September 05, 2003 by Earth Search Sciences, Inc. using a Probe-1 spectrometer, which covers a 128 channel swatch range from 0.4µm to 2.5µm. The raw data was processed and imported into Idrisi Kilimanjaro software, where the data was rescaled in the range of 0 to 1. Additionally, ground truth data was collected for ash trees with different health status. No geometric correction was performed. Methodology: An unsupervised classification was performed on the first seven PCA components. Five classes were derived from 20 clusters in order to define an area without tree cover. The hyperspectral images were masked out with an area that is not tree covered. Spectral Mixture Analysis was performed on masked out images. Ground truth data was used to determine the membership of different health status of the ash trees. 128 bands, Spectral resolution 0.4-2.5µm Masked out image with non-tree cover area. Green vegetation is incorrectly classified as tree cover. Tree Cover Fraction Non vegetation Fraction Senescent Grass Fraction Green Grass Fraction Conclusion and Discussions Ground truth data was not sufficient (10 points) in order to allow extraction of endmembers for different health status of ash trees on the scene. The ground truth data was used to determine the range of distribution of percent membership for different health status trees from the tree cover fraction. The box-plot diagram bellow shows a slight difference in the range of membership for affected and dying trees. The healthy trees have high values of membership in the fraction. Spectral Mixture Analysis A linear mixture modeling was performed with masked out hyperspectral images in order to describe mixed pixels contained in the tree scene. This is with regards to the spectral variability between the selected endmembers. HYPERUNMIX module is applied to separate tree cover from the other spectral components that have not been separated by unsupervised classification. As a result four fraction images were produced: Tree cover, Non-Vegetation, Senescent Grass and Green Grass fraction. The result of above analysis indicates that detection of EAB infestation in the study area is difficult because of similarity in the reflectance from affected and dying trees. The graph on the right shows that the Green and Senescent Vegetation are not well separable. SMA modeled the tree area with a high value and green vegetated area with a lower value. SMA modeled senescent grass among the forest area. SMA modeled green grass correctly with percent distribution among the tree cover. SMA modeled some pixels from the forest area as non-vegetation.