Download
1 / 10
100 likes | 300 Views
Morning Session. Presentations. Programme. MC : Byron Anangwe. DAY 2 Summary. FAO Land Cover Mapping methodology, tools and standards & GLC–SHARE database Renato Cumani. MC : Byron Anangwe. The USGS global land cover mapping initiative. Land use and land cover

E N D
Morning Session Presentations Programme MC : Byron Anangwe
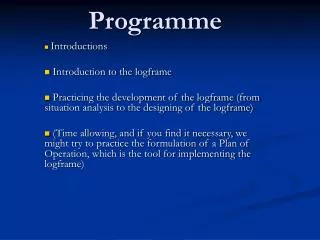
DAY 2 Summary FAO Land Cover Mapping methodology, tools and standards & GLC–SHARE database Renato Cumani MC : Byron Anangwe The USGS global land cover mapping initiative Land use and land cover mapping at the Joint Research Centre Alan Belward • Main Activity • Putting information within reach; • Sharing policy expertise; Providing a meeting place for nations; Bringing field knowledge • Main objectives • improve linkages • standardization, homogenization, compatibility • validation of land cover • use and sharing of remote sensing data • comparable products • capacity development and institution strengthening • operational development and use • FAO GLCN Core activities • Standards and Classification SystemLCCS / LCML / ISO 19144-2:2012 • LCCS databases • Mapping Device – Change Analysis Tools (MADCAT) • Current initiative is a 30m resolution landcover to • Reason why? • For global consistent and locally relevant • Permits detection of land change • Method stacking all images and using them to classify and generate LC sa opposed to using onetime imagery • Validation @ 500*500 & 100*100 km sq • Displayed a number of examples of classifications done in Kenya-Lodwar, SA- Kwazulu Natal e.tc • Showed the new initiatives in close to real time landcover mapping • Has 6 dedicated space resources • Other than satellites the other services are: • Land monitoring services for: • European Union-urban • Global component- S3 resolution product, the need for 30m resolution datasets • There is an action plan for digital observatory to protected areas • Trend indicate that decline in recovery and regeneration of vegetation is evident • Sentinel spatial temporal and spectral characteristics provide huge potential for LC /LU user satisfaction
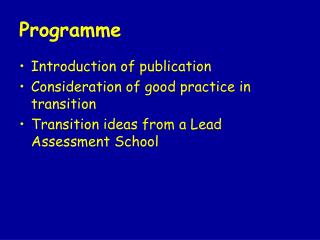
Health Break Mid Morning / Early Afternoon session Group presentations Presentations Programme MC : Byron Anangwe Lunch
U.S. EPA African activities supporting national GHG inventory Mapping in six ESA countries Phoebe Oduor Global and African Crop Land and Crowdsourcing Steffen Fritz JICA National Land Cover Datasets in African Countries Hiroshi Sasakawa Ph. D. • Countries participating in the project Malawi; Rwanda; Tanzania • Zambia; Namibia; Botswana • Overall Project Aims: • Strengthen the institutional arrangements • Enhance the technical capacity of designated personnel • Improve national methodologies, activity data and emission factors • operational development and use • Objectives • To collect ancillary and ground reference data –validate lc. • To develop LC maps from Landsat satellite images using RS sensing techniques for 2000 and 2010 epochs. • Development of replicable and consistent procedures. • To build capacity of the countries through training on Land Cover mapping for GHG Inventory Development in the ESA Region. • Classification scheme • Scheme I: IPCC define • Scheme II: defined by the country • General scope of JICA • Development of forest resource inventory system • Basic info for REDD+ • Contribution for sustainable forest management • Generation of National biomass amount and inventorisation • Presented a case study of Gabon and how they have mapped out different forest types • He presented the methodology and approach with the utilization of pan-sharpened imagery and extracting training sites for object oriented supervised classification • The data has been utilized to determine areas that have been logged. • Direct (high res)a nd Indirect (constant distance) • Driven by the Need for Better Cropland Maps • Spatially incorrect • Need % cropland • Need crop type distribution maps • Needs more ground validation • Looking into the future with best available global data • Working on tools that will help compare a variety of products at various locations • They have developed a tool to allow some validation on the ground using Crowdsourced geo-wiki points via validation DAY 2 Summary MC : Byron Anangwe / Shuaib Lwasa
Capacity building remains their core objective • Conclusion • Land Cover maps produced are envisaged to be used as an input in the ALU tool (Agriculture Land Use tool • ALU tool uses an empirical formula to determine the GHG emissions for a country using activity data from different sectors: Agriculture, Transport, Industrial, Energy and Waste. And using Land cover maps as baseline data. • Recommendations • Extension of GHG land cover mapping to include more countries. • A reconnaissance exercise which was not supported due to budgetary limitations should be included. • Extensive field work to ensure that most of the country is covered for more reliable accuracy assessment. • Development of Scheme III Land use Land cover maps.
Malawi REDD+ Readiness Program John Kerkering • He started off with a background presentation on the size, and demographic dynamics 2% pop growth rate • High forest cover loss in 1090-2000 4.8% decrease • Drivers of deforestation pop growth; fuel wood; insecure land tenure; policy implementation • Objectives and progress • Expectations • Community development • Government coordinated activities and initiatives • Short term • Education and awareness • Development of a national lC classification system • Harmonization of existing lcluse data • National forest inventory & MRV • Long term • Empirical review of drivers and development of corresponding emissions and national and sub-national spatial data • Implementation of NFMS and MRV strategies UN-REDD Programme Example from Nigeria, Tanzania Spatial decision support software for land use planning Using Marxan for REDD+ Linking the above with economic Global forest watch 2.0 DAY 2 Summary MC : Byron Anangwe / Shuaib Lwasa
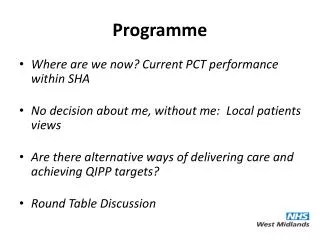
Morning Session Health Break Mid Morning / Early Afternoon session Group presentations Group presentations Your Text Presentations Presentations Presentations Presentations Programme MC : Byron Anangwe Health Break Dinner @ Safari Park Lunch Afternoon Session Evening Session
Plenary sessions Presenters Plenary S4 Plenary S3 Plenary S2 Plenary S1 Lots of data has been produced by JRC but still there is need for ownership by the respective Countries Outreach and education on how to interpret this information is required. GLCN is working on a tool to allow integration of LCCS 2 into 3 Capacity building can be done upon the request of the country The software is provided free to universities and research institutions Input: Maybe other technologies can be exploited with respect to data cataloging, harvesting, and identification; why should there be lots of expense in creation of metadata maybe other technologies like text search being utilized by google can be of great essence. There is need to relate and associate the importance of social economic uplift of the society with respect to available landcover of the society. There are a number of FOSS that are available for use but to date there has been no forum for discussions on merits and demerits and limitation of some of them There are similar LC mapping initiatives on the ground and it would have been more beneficial to Partner up with the rest It would be great if other classification algorithms could be utilized to improve on the quality of output results other than depending on single one e.g maximum likelihood There is merit in change detection if areas of high probability of change can be prioritized and areas of low probability change can be ignored. There are a number of FOSS that are available for use but to date there has been no forum for discussions on merits and demerits and limitation of some of them
Thank You ! Asante Sanya Strategic Environmental Assessment (SEA) refers to a range of analytical and participatory approaches to integrate environmental consideration into policies, plans, or programs (PPP) and evaluate the interlinkages with economic and social considerations
Thank You Asante Sanya Gabriel Sanya