Download

1 / 20
220 likes | 348 Views
Case Story from Novo Nordisk: CCS — Control Chart Script. Jørgen Iwersen, Principal Scientist Torben Koustrup Sørensen, Principal Scientist. CCS – Control Chart Script.

E N D
Presentation title Case Story from Novo Nordisk: CCS— Control Chart Script Jørgen Iwersen, Principal Scientist Torben Koustrup Sørensen, Principal Scientist
Presentation title CCS – Control Chart Script • CCSis an GxP-critical IT-system for automated generation of control charts and trend reports in the production area of Novo Nordisk A/S • Current version is using of-the-shelf products such as SAS JMP®, Citrix and Microsoft Excel • CCSis by and large a JMP-script. Code modification is dependant of SAS JMP–programmers
Presentation title CCS – Control Chart Script • The number of users on CCShas increased from 600 users in 2011 to over 1100 users in start 2013 and the system is in use in all production areas of Novo Nordisk A/S • CCSis currently handling over 5000 control charts. This number is steadily increasing
Presentation title CCS – Control Chart Script • CCS generates a control chart and report through information from user defined Control Chart Definition Files • The control chart and report can be saved in HTML and viewed on the Novo Nordisk Intranet • As a minimum a CCS-report is composed of the control chart itself and an information block documenting the control chart parameters. Optionally the report can contain a distribution- and capability analysis and a table with selected raw data
Presentation title CCS – Control Chart Script • Computer systems used in the pharmaceutical industry with GxP-impact are subject to the most strict quality management requirements, including document control and retention • Control charts used in the GxP-environment are updated based on controlled and approved process results stored in the GxP-data warehouse (QDW)
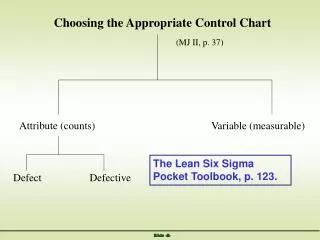
Presentation title CCS – Control Chart Script Five types of control charts are available: • I: Individual chart • IM: Individual/Moving Range chart • L: Levey Jennings chart • XR: Shewhart-R chart • XS: Shewhart-s chart
Presentation title CCS – Control Chart Script • The properties of the control chart, e.g. range span/sample size etc., are controlled in the main parameter file
Presentation title CCS – Control Chart Script Data flow • Live data are accessed from a qualified and validated data warehouse that contains relevant GxP-data and non-GxP data. Data are extracted from the data warehouse to Excel and imported into JMP • CCS is used for both in-process data (non-GxP data) and release data (GxP data) from production sites
Presentation title CCS – Control Chart Script • GxPdata In the GxP-environment relevant QDW data can be chemical analysis results from analytic laboratories for release test activities. The measurements are transferred to the data warehouse on a daily basis. CCS is updating control charts and the CCS Report ‘Review of Submission results’ • non-GxP data IPC-charts used in non_GxP-environment can be elaborated from data automatically entered into excel files from local process equipment
Presentation title CCS – Control Chart Script • Elaboration of Control Charts • The first step in calculating the control limits for a control chart is choosing/selecting data from a time period in which the natural variation of the process are represented. In most cases chemists are to choose data from a relatively stable and constant period of time covering at least 20 observations sampled under normal manufacturing conditions. Data from a time period of one year are typically used in GxP-Control Charts. • Control limits can be adjusted for controllable variation. Season variation is a typical variance component that often has to be accounted for in chemical manufacturing. Control limits can be adjusted by season, in which change in the process level can be correlated to temperature, relative humidity, pressure etc. • Run rules can be applied. The recommended run rules are Run Rule No.1 (in JMP Test 1) “One point beyond Zone A” and Run Rule No. 5 (Test 5) “Two out of three points in a row in Zone A or beyond”. • When elaborating a control chart for a new process the functionality of the control chart is tested in a test environment in CCS – the CCS Sandbox. • In CCS it is possible to apply the use of action limits. Action limits are typically in between control- and specification limits for the process. When the distance from control limits to specification limits are very large action limits can be added on the control chart. • Action limits are often used when the analytic results are close to e.g. LoD – Limit of Detection, and in similar situations where the variance estimates are invalidated. • Updating Control Charts • Updating the control charts are scheduled and regulated in CCS and must be undertaken as a minimum every year and after implementing process changes.
Presentation title CCS – Control Chart Script Elaboration of Control Charts • When elaborating a control chart for a new process the functionality of the control chart is tested in a test environment in CCS – the CCS Sandbox • Selection of data period: data should come from a time period in which the natural variation of the process are represented • In most cases chemists are to choose data from a relatively stable and constant period of time covering at least 20 observations sampled under normal manufacturing conditions • Data from a time period of one year are typically used in GxP-Control Charts
Presentation title Figure 1. Overview of data flow in CCS
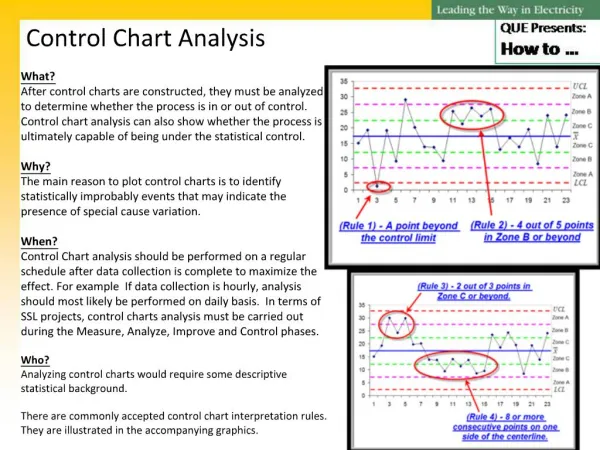
Presentation title CCS – Control Chart Script Elaboration of Control Charts • Run rules can be applied. The recommended run rules are Run Rule No.1 (in JMP Test 1) “One point beyond Zone A” and Run Rule No. 5 (Test 5) “Two out of three points in a row in Zone A or beyond” • Control limits can be adjusted for controllable variation. Season variation is a typical variance component that often has to be accounted for in chemical manufacturing. Control limits can be adjusted by season, in which change in the process level can be correlated to temperature, relative humidity, pressure etc.
Presentation title CCS – Control Chart Script • In CCS it is possible to apply the use of action limits. Action limits are typically in between control- and specification limits for the process • Action limits can be used when the analytic results are close to e.g. LoD – Limit of Detection, and in similar situations where the variance estimate is invalidated
Presentation title CCS – Control Chart Script Updating control charts • Updating the control charts are scheduled and regulated in CCS and must be undertaken as a minimum every year and after implementing process changes
Presentation title CCS – Control Chart Script Example: CCS control chart for xxx_Ethanol • Data from a period of three months has been sampled for a the GxP-parameter • The CCS report presents the following descriptive statistics from JMP
Presentation title CCS – Control Chart Script Individual Measurement (I) chart vs. Submission Creation Date Numerical Result vs. Sample
Presentation title CCS – Control Chart Script Advancement of CCS • On-going CCS development activities are focusing on capacity expansion and incorporation of customer claimed enhancements to the system • Control charts and other statistical techniques for control and surveillance are planned to be rolled out in the framework of a new version of CCS covering a broader spectrum than the production areas • Future versions of CCS should account for a diverse SPC system landscape – from control of laboratory analysis methods to surveillance of marketed products