Download
1 / 55
550 likes | 693 Views
Transformation of geographical information i nto linguistic sentences: Two case studies. Jan Terje Bjørke. Levels of communication Information reduction, the application of BLOBs Fuzzy BLOBs The description of topological relations between fuzzy BLOBs.

E N D
Transformation of geographical information into linguistic sentences: Two case studies Jan Terje Bjørke
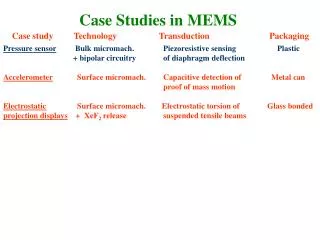
Levels of communication Information reduction, the application of BLOBs Fuzzy BLOBs The description of topological relations between fuzzy BLOBs A travel: The sea floor seen from a submarine The design of navigation instruments based on risk factor computation The description of the risk factor in natural language Conclusions Overview
Syntactic level: low level information, i.e., the map symbols or the words, Semantic level: the meaning of the map symbols, Pragmatic level: the application of the map information, i.e., the meaning of the map symbols related to a certain application. e.g.: S=1000m. e.g.: the distance from A to B is one thousand meters. e.g.: the distance from A to B is rather short. Communication levels
Channel capacity Useful information = Entropy – Equivocation The channel capacity C is defined as: C=max(R) where R= H(y)-H(Y|X)
Entropy where is a measure of the amount of information.
Equivocation where is the conditional probability that symbol x is interpreted as symbol y.
Dot size r=5 Dot size r=10 Optimize the communication at the syntactic level by eliminating conflicting map elements Max R when r= optimal symbol size Max R, when r=10 Max R, when r=5
Group elements, i.e., create BLOBs (Wright and Kapler):Move the information to a higher level of abstraction
Crisp or fuzzy BLOBs Fuzzy BLOB Crisp BLOB Fuzzy BLOB
How to visualize the topological relation between fuzzy regions
Disjoint Disjoint touch Touch disjoint Touch Touch overlap How to talk about topological relations between fuzzy BLOBs? • Overlap touch • Overlap • Overlap inside • Inside overlap • Inside
The computation is based on the similarity to the crisp 4-intersection This requires a definition of: fuzzy interior fuzzy boundary concept for the similarity computation. This concept can be based on union and intersection operators for fuzzy sets. Computation of topological relations between fuzzy regions
A fuzzy region and its boundary A fuzzy region Its boundary
The fuzzy 4-intersection The crisp 4-intersection
Fuzzy region A is defined by its membership function as: The interior of A is defined as: The boundary of A is defined so it has its maximum membership value for points wich are midway between the exterior, i.e. the complement, and the interior of A. Definition of topological properties of fuzzy regions if else end
Demonstration of linguistic descriptions of topological relations between fuzy regions Inclusion index
Apply natural language sentences as: the risk is low; the risk is high; the risk is very high. Natural language has many dialects, multiple representation; Goal: find an iconic representation which is close to the natural language statements considered. Risk factor
Perception of distance • The perception of distance is investigated among 40 subjects. Each of them was asked to evaluate the propositions: • the distance is large • the distance is small • Several maps were designed. The maps were presented on a 20 inc. screen in a window of two kinds of size. • Size of window 1: 30 x 20 cm. • Size of window 2: 40 x 30 cm.
Several point symbols in each window The test plates One point symbol in each window The subjects were asked to evaluate the distance from a certain circle to the shore line
The two propositions distance is large / short come out as complementary statements 0.4 1.0 Distance is large Membership value Distance is small 0.4 1.0 normalized window size
The scale effect • The effect that the interpretation of the distance between the map symbols depends on a relation between the bounding frame and the map scale, is termed the scale effect. • The scale effect can be utilized in the design of instruments. very large large small
The navigation intruments 6 axis: port starboard ahead backwards up down very high high risk risk low risk Metrical information can be turned on When the metrical information is turned on, the instrument shows both the degree of risk and the distance to the terrain surface. The scale is selected so that the yellow bar has a length 40% of its maximal length when the risk is on the boarder between high and low. 0m 0m 100m 50m 500m 200m
up Research questions: how is this instrument perceived? is it too complex? The navigation intruments a d e h a port starboard backward down
Simulation of a travel in the terrain model • The next views simulate a travel in the terrain model. • They illustrate the problem of visualizing how safe the vessel rout is.
degree of risk route map profile
risk profile