Download
1 / 15
150 likes | 329 Views
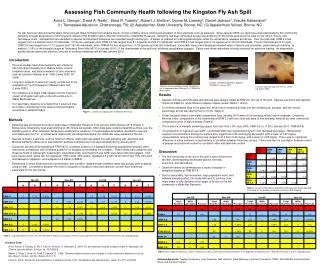
The Effects of Fly Ash Release from the TVA Kingston Steam Plant on Fish TVA-Kingston Fly Ash Release Environmental Research Symposium August 2-3, 2011 Donny Lowery, Kurt Lakin and Tyler Baker. Overview. Fish Community Survey Spring Sport Fish Survey. Fish Community Survey. Methods

E N D
The Effects of Fly Ash Release from the TVA Kingston Steam Plant on Fish TVA-Kingston Fly Ash Release Environmental Research Symposium August 2-3, 2011 Donny Lowery, Kurt Lakin and Tyler Baker
Overview • Fish Community Survey • Spring Sport Fish Survey
Fish Community Survey • Methods • Fish assemblage sampled at 3 sites in autumn 2009 and 2010 • Two sites (Clinch 4.4 and 1.5) sampled in 2001, 2003, 2005, and 2007 • Fifteen 300-meter electrofishing runs and ten overnight, experimental gill net sets per site • All fish indentified, enumerated, and visually inspected for general health Ash Release Site Emory 2.5 Clinch 4.4 Clinch 1.5
Fish Community Survey • Community results evaluated using multi-metric scoring method (Reservoir Fish Assemblage Index or RFAI) • Species Richness and Composition • Trophic Composition • Fish Health and Abundance • Developed in early 1990s as part of TVA’s Valley-wide Vital Signs Monitoring Program
Fish Community Survey Species Richness and Composition Metrics • Total number of species • Number of centrarchid species • Number of benthic invertivore species • Number of intolerant species • Number of top carnivore species • Percent tolerant individuals • Percent non-native species • Percent dominance by one species Trophic Composition Metrics • Percent individuals as omnivores • Percent individuals as top carnivores Abundance Metrics 11. Average number per run Fish Health Metrics 12. Percent individuals with anomalies
Fish Community Survey • Results • RFAI scores rated Fair to Good; highest scores nearest spill area • In 2009, Emory 2.5 scored higher in number of native species, number of benthic invertivores, and % non-native species • In 2010, RFAI scores and individual metric scores very similar among sites Reservoir Fish Assemblage Index Scores 2001-2010
Fish Community Surveys Fish Species Richness 2001-2010 Results • Species richness in 2009 and 2010 similar to that observed prior to the spill • Greatest number (40) at immediate near-field site (Emory 2.5) in 2010 • Differences in “incidental” species with historic median catch rates of 0 to 1
Fish Community Survey Electrofishing Catch Rate 2001-2010 • Results • Catch rates in 2009 and 2010 similar to that observed prior to the spill • Overall, highest catch rates in 2010 * * * * Long-term Average Catch Rate * Not Sampled
Spring Sport Fish Survey • Methods • Quantitative survey of black bass at 2 sites in spring 2009 and 2010 • One site (Clinch 2.5) sampled as part of TVA’s Valley-wide Monitoring Program in 2002, 2003, 2004, and 2005 • Twelve 30-minute electrofishing runs at fixed stations at each site • All bass measured, weighed, enumerated, and visually inspected for general health Emory 2.5 Ash Release Site Clinch 2.5
Targeted species • Black bass • Largemouth bass • Smallmouth bass • Spotted bass
Survey Data Collected • Population dynamics • Catch rate • Length frequency • Age and growth • Relative weight • Year class strength • General health • Provides base line data on sport fish populations
Habitat Types Rip Rap Aquatic Vegetation Boat Docks Rock/Bluff
Spring Sport Fish Survey • Results • Six years of data from Clinch 2.5; 2009 and 2010 catch rates highest observed • Catch rates at Emory 2.5 in 2009 and 2010 slightly lower than at Clinch 2.5, but similar to Clinch River’s long-term average of 51.2 fish/hr • Anomalies observed in 1.3 to 2.8% of bass collected in 2009 and 2010; lower than 2002-2005 average of 3.7% for Clinch 2.5 Spring Sport Fish Survey Catch Rates and Percent Anomalies
Spring Sport Fish Survey Length Frequency Histograms for Largemouth Bass Spring 2010 Spring 2009