Download
1 / 32
320 likes | 431 Views
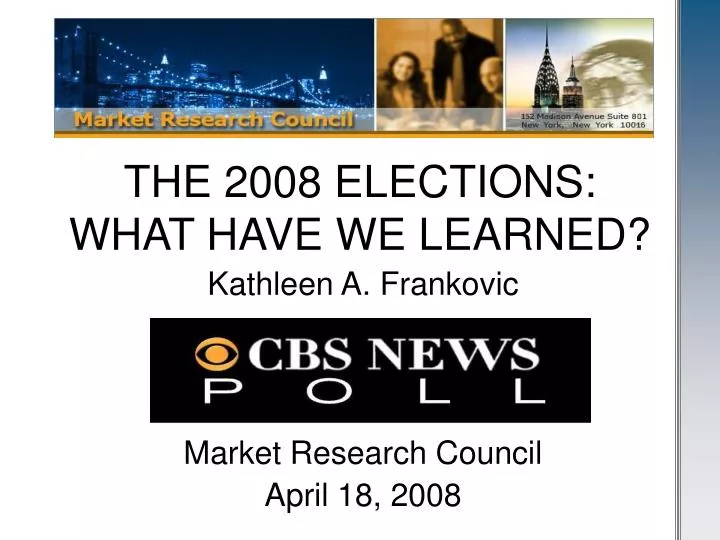
THE 2008 ELECTIONS: WHAT HAVE WE LEARNED?. Kathleen A. Frankovic Market Research Council April 18, 2008. WHAT WE HAVE LEARNED. I. More isn’t necessarily better (the case of New Hampshire) II. More to learn the role of race and gender Interviewer effects III. Market research impact.

E N D
THE 2008 ELECTIONS: WHAT HAVE WE LEARNED? Kathleen A. Frankovic Market Research Council April 18, 2008
WHAT WE HAVE LEARNED I. More isn’t necessarily better (the case of New Hampshire) II. More to learn • the role of race and gender • Interviewer effects III. Market research impact
I. THE CASE OF NEW HAMPSHIRE • Timing: January 8, five days after the Iowa Caucuses … and not long after the holidays • Everything changed after Iowa • A new frontrunner • 24-hour media coverage • And ad expenditures - $23 million on TV
THE N.H. POLLS • Only 3 of the 24 had Clinton ahead – one was tied; only one outside margin of error • Pollsters and media focused on what looked like spectacular movementObama Clinton • USA Today/Gallup (1/4-6) 41% 28% • Reuters/C-Span/Zogby 42% 29% (1/5-7)
THE FLUID ELECTORATE 11/07, Re-interviews 1/5-6/08 • 11/07: Clinton 39%, Obama 19%, Edwards 9% • 1/08: Obama 35%, Clinton 28%, Edwards 19% -- • 26% of likely Democratic primary voters had changed preferences since November • 28% with a choice in January said their minds could still change (2 days before the primary)
THE FLUID ELECTORATE 11/07, Re-interviews 1/5-6/08 • Many of those who had switched from November had switched from Clinton, suggesting they could change back • Many of the potential changers were female, and the female potential changers were supporting Obama and Edwards – just 8% were supporting Clinton
WHAT HAPPENED IN NEW HAMPSHIRE What about race and non-response? Were the polls missing less educated voters? Or were those supporting Clinton unwilling to say so? NOT IN NEW HAMPSHIRE! -- January re-interview rates were the same for those supporting Clinton in November and those supporting Obama
II. ASKING ABOUT RACE AND SEX • Voter demographics vs. issues in the Democratic campaign: race, gender and social class • Sorting out the impact of who the candidates are means looking at questions that date back to the start of scientific polling – and their weaknesses • Concerns about the validity of the responses -- social desirability/impact of interviewer characteristics (race and gender of interviewers) – possibly rising as the campaign continues
EARLY POLLS “Would you vote for a woman for President if she were qualified in every other respect?” Yes 33% No 64 (Gallup: 1/37) “Would you vote for a woman for President of the United States?” Yes 20% Disapprove 73 (PRS: 1/40)
WOMEN’S EXPECTATIONS GALLUP: “How would you feel about having a woman as President of the United States?” Approve 28% Disapprove 63 (6/62) VIRGINIA SLIMS: “There won’t be a woman President of the U.S. for a long time and that’s probably just as well.” Agree 67% Disagree 23 (8/70)
CHANGE IN THE 1970’s TIME MAGAZINE: “Considering the state of the country and the world today, do you think it would be good for the country or bad for the country to have as president someone who was a…. Good Bad Business exec 60% 25 Priest 14% 69 College professor 40% 43 Jew 46% 24 Atheist 19% 60 Woman 60% 20 Black 56% 22 (4/79)
SOCIAL DESIRABILITY-SEX Would you personally vote for a candidate who is a woman…? … Do you think most people you know would….? Do you think America is ready to elect a woman president? RVs DemPVs YOU 81% 93% Most people you know 56% 66% America ready 54% 65% CBS/NYT POLL, 1/08
SOCIAL DESIRABILITY-RACE Would you personally vote for a candidate who is black…? … Do you think most people you know would….? Do you think America is ready to elect a black president? RVs DemPVs YOU 90% 94% Most people you know 65% 71% America ready 54% 54% CBS/NYT POLL, 1/08
CONCERNS Women and blacks are more skeptical about their own group’s chances America is ready for: Democratic Primary Voters A women president Men 69% Women 62% A black president Whites 58% Blacks 48%
PERCEPTION OF DISCRIMINATION In presidential politics today (2008), who do you think faces more obstacles--a black candidate or a woman candidate? Black Woman Total 33% 39 Men 40% 32 Women 27% 46 Whites 29% 42 Blacks 55% 18 CBS News Poll 3/08
2008 VOTE: ADMITTING BIAS? NEP Exit Polls: “In deciding your vote for president today, was the (race/gender) of the candidate: the single most important factor, one of several important factors, not an important factor.” • Typically, eight in ten voters say each was NOT a factor • But that still leaves one in five
MARCH 4 EXIT POLLS IMPORTANT FACTOR:RACE SEX White men 16% 11% White women 15% 18% Black men 27% 29% Black women 26% 24% Hispanic men 22% 24% Hispanic women 27% 34%
WHO BENEFITED? GENDER AS A FACTOR: Clinton Obama White men 59%+ 41 White women 80%+ 20 Black men 9% 91 Black women 20%+ 80 Hispanic men 63% 37 Hispanic women 80%+ 20
WHO BENEFITED? RACE AS A FACTOR: Clinton Obama White men 68%+ 29 White women 74%+ 26 Black men 6% 94+ Black women 8% 92+ Latino/Hispanic men 63% 37 Latino/Hispanic women 72% 28
SOCIAL DESIRABLITY • Evidence from both in-person and telephone polling • Respondent response to interviewer characteristics • Voting behavior in racially charged situations and other questions • Gender differences on some women’s issues • Direction: racial or gender solidarity AND carefulness
INTERVIEWER EFFECTS? • Little evidence in early 2008 polling • Did the Wright controversy change things? …MAYBE... • Evidence of possible race of interviewer effects in recent CBS News telephone polls after Obama confronted Wright controversy
EXIT POLL ERROR • Historical overstatement of Democratic vote 6.6 5.0 2.2 1.8 2.2
EXIT POLL ERROR • Correlates of error – who responds: • Younger voters • Better educated voters • More enthusiastic voters • All of these characteristics favor Obama • Interviewer characteristics/election officials may also be a factor: age in 2004, potentially race and gender in 2008
III. OUR “MARKET RESEARCH QUESTIONS” December MRC meeting – Chris Jaworski and the four-part measurement of customer loyalty – TR*M: -- Overall rating -- Repurchase -- Competitive advantage -- Word of mouth (recommendation) CAN WE TRANSLATE THAT INTO POLITICS?
2008 QUESTIONS • Rating: BASIC SUPPORT; OVERALL RATING (Favorable-Unfavorable) WHAT POLLSTERS ALREADY GET • Repurchase: Probably not an issue when there is no incumbent • Competitive advantage: How much better is one candidate than another? • Word of mouth: Would you recommend?
2008 QUESTIONS Competitive advantage: How much better is one candidate than another? Usual measures of strength are based on non-comparative assessments: “… strongly support your choice, support your candidate but with reservations, or are you mostly against the other candidate?” OR Separate items: “consider voting for…?”
2008 QUESTIONS Competitive advantage: How much better is one candidate than another? NEW QUESTION: “Would you say you like …a great deal better than any other…, somewhat better…, or only a little better…?”
2008 QUESTIONS Word of mouth: Would you recommend? NEW QUESTION: “When you have talked with people who are planning to vote in a primary or caucus, have you ever recommended that they support … or haven’t you done that?”
2008 RESULTS-IA Competitive advantage Clinton voters Obama voters Great deal 36% 56% Somewhat 53 34 A little 11 9 Word of Mouth Recommended 46% 61%
2008 RESULTS HAD WE ONLY PAID ATTENTION! THIS YEAR, IT ALWAYS COMES BACK TO NEW HAMPSHIRE! …Where once again, poll difficulties brought media and professional scrutiny
HAVE WE LEARNED MORE? • Back to basics in election polling • Methods matter, and there is much more to do this election year • Cell phones • The changing – and growing – electorate --- …AND A LITTLE MORE CAUTION WOULD HELP, TOO!
THE 2008 ELECTIONS: WHAT HAVE WE LEARNED? Kathleen A. Frankovic Market Research Council April 18, 2008


![Election Expenditure Monitoring [EEM] BRIEFING OF MASTER TRAINERS- Assembly Elections- 2013](https://cdn1.slideserve.com/3291075/election-expenditure-monitoring-eem-briefing-of-master-trainers-assembly-elections-2013-dt.jpg)

![Election Expenditure Monitoring [EEM] BRIEFING OF DEO/ROs/MTs Assembly Elections- 2013](https://cdn2.slideserve.com/4678230/election-expenditure-monitoring-eem-briefing-of-deo-ros-mts-assembly-elections-2013-dt.jpg)

![Election Expenditure Monitoring [EEM] BRIEFING OF MASTER TRAINERS- Assembly Elections- 2013](https://cdn3.slideserve.com/6877665/election-expenditure-monitoring-eem-briefing-of-master-trainers-assembly-elections-2013-dt.jpg)