Download
1 / 23
230 likes | 349 Views
IT Investing for High Performance A Global Survey of CIOs. March 2006 Ian Cassidy. Abundance of spending data, but what about performance?. Studies abound with IT spending data worldwide, by industry sector and by geography.

E N D
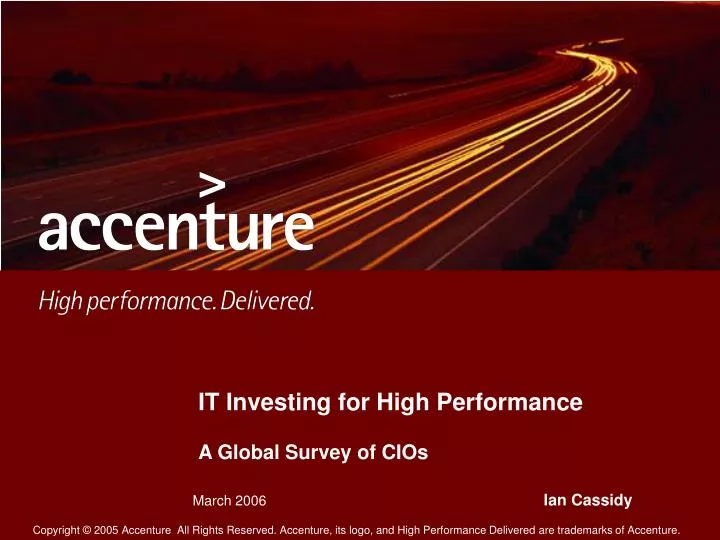
IT Investing for High PerformanceA Global Survey of CIOs March 2006 Ian Cassidy
Abundance of spending data, but what about performance? Studies abound with IT spending data worldwide, by industry sector and by geography. The major research firms continue to measure and report IT spending – a useful indicator of where the industry is headed. What’s missing is the quality of the spending. How is IT performing? How is IT performing today? How should it perform in the future? This is the true indicator of the value of information technology, and its role in helping organizations perform at higher levels.
Accenture set out to study the drivers of performance in managing and executing IT • Base of 400+ online surveys in the U.S., UK, France, Germany, Italy, Argentina, China, Japan • Cross-section of all industries and government • Fortune 1000 size organization and their equivalent • Large government agencies at the national, regional and local levels • CIO or the senior-most IT executive • Field research began in early January 2005 • Field research currently taking place in China and Japan • Longitudinal research planned for 2006 and beyond The High Performance IT research program
1 2 3 4 5 The survey asked CIOs to rate how their IT is performing today, and how it should perform in the future, against 33 proprietary indicators Today Target Basic Progressive Pioneering 3.35 3.95 Innovation Gap = .5 2.55 3.80 Integration Gap = 1.25 4.00 2.93 Industrialization Gap = 1.07 4.28 3.08 Infrastructure Gap = 1.20 2.75 4.10 Information Gap = 1.35
Respondents cover all sectors and both clients and non-clients n=235
We segmented the respondents using the 33 indicators by high-, average- and low-performing IT organizations Respondents were segmented based on current performance. IT organizations scoring an average of 4 or 5 (pioneering) across the indicators were categorized as “high-performing.” IT organizations scoring an average of 3 (progressive) were categorized as “average- performing.” Those scoring an average of 1 to 2 (basic) were categorized as “low-performing.”
Our results reveal five major findings that chart a path to higher levels of performance…but uncover obstacles along the way • Winning the battle on cost efficiency, but losing the war on performance • Why spending is not investing: looking at the quality of IT spending • More work in 2005 than money • How high performers differ from average performers • Getting it right: what we can learn from manufacturing
High-performing IT organizations differ from average - and low - performers High performers: • Are more aggressive adopters of newer technology • Spend more time building and less time fixing systems • Manage to significantly more performance metrics • Drive more online transactions in customer, supplier and employee interactions.
Low Performers Primary Cost Driver % of Budget High Performers 29% 12% 17% 14% 9% 9% 10% 30% 5% 17% 18% 10% 10% 10% 32% 16% 14% 12% 7% 9% 10% Running Fixing Enhancing Building Integrating Testing Deploying Age of systems (30%) Errors (51%) Growth (40%) Growth (48%) Growth (25%) Errors (27%) Growth (35%) Where is the money going and why?
1 2 3 4 5 Public Sector and Performance metrics Importance Access Not important / No access Very important / Complete access Rank order of my applications by technical and business fit G O G Root causes of execution delays on projects O How I am leveraging scarce skills in my organization G O Productivity differences between my people G O Amount of time my people spend working on projects with unclear requirements G O Total IT spend in my entire organization on hardware and software G O Post mortem reviews of projects G O Amount of time my people spend in delays in waiting for business direction G O = Government G O = Overall Average
High performers utilize a more rigorous, structured decision-making process
High-performing IT organizations drive significantly higher online utilization levels High Performers 20% 33% more customer online transactions than average performers Percent of total CUSTOMER interactions that ARE online Average Performers 15% Low Performers 10% High Performers 20% Percent of total SUPPLIERinteractions that ARE online 33% more supplier online transactions than average performers Average Performers 15% Low Performers 15% High Performers 25% 25% more employee online transactions than average performers Percent of total EMPLOYEEinteractions that ARE online Average Performers 20% Low Performers 15%
Public Sector and Online Utilisation …COULD BE online 30% Overall Average Percent of totalCUSTOMER interactions that…. …ARE online 15% …COULD BE online 35% Government …ARE online 15% …COULD BE online 30% Percent of totalSUPPLIERinteractions that…. …ARE online 15% …COULD BE online 30% Government 10% …ARE online …COULD BE online 40% …ARE online Percent of totalEMPLOYEEinteractions that…. 20% …COULD BE online 35% Government …ARE online 15%
5 4 3 1 2 Public Sector Industry Questions To what extent do you have a centralized IT Asset Management program for hardware and software licenses? No Management of hardware and Software assets All Hardware and Software inventoried and optimized Are privacy protection regulations and security constraints limiting your ability to integrate within your organization, share data across organizations or implement effective business systems? No, they are not having any impact Yes, they are having a large impact What governance processes are used to select IT Investments? Opportunities are evaluated case by case as they come up during the year Thorough enterprise wide review with business owners How frequently is ROI calculated after a project is implemented and compared to the original business case? Never Always
5 4 3 1 2 Public Sector Industry Questions (Cont’d.) To what extent do you value best practices from the private sector? Extremely valuable, help guide our decisions Not at all relevant How effective are your current IT capabilities at meeting the objectives and mission of your agency? Very effective, It is highly aligned with the program areas Not at all effective To what extent have you exposed business processes to external customers or suppliers for mission critical functions (i.e. beyond a pilot project)? Widespread many external web services None
Performance, not cost, must be the IT endgame Adopt a “performance first” strategy Speed, efficiency, quality is more valuable than cost Take a lesson from the history of the U.S. automobile market Adopt industrialization lessons learned by manufacturing
Without performance metrics, IT agendas will stall First step is a change in mindset in the CIO’s office and line businesses Monitor online interactions as an indicator of value to the business Measure twice, cut once Manage to better performance ratios
IT investment is not an event, but a way of life Invest steadily, irrespective of earnings fluctuations or tax returns Organizations that invest regularly, gain competitive advantage
For more information www.accenture.com/ciosurvey