Download

1 / 14
521 likes | 1.37k Views
Alternatives. Quarter. Beginning. 1. inventory. Regular. Quarter. time. 2. 1. Overtime. 3. Subcontract. 4. Unused Capacity. Regular. time. 2. Total Capacity. Overtime. Subcontract. Regular. time. 3. Overtime. Subcontract. Regular. time. 4. Overtime. Subcontract.

E N D
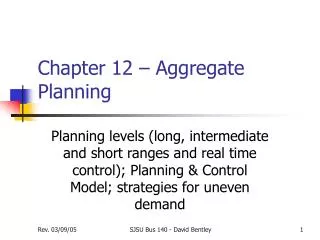
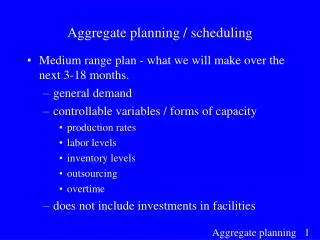
Alternatives Quarter Beginning 1 inventory Regular Quarter time 2 1 Overtime 3 Subcontract 4 Unused Capacity Regular time 2 Total Capacity Overtime Subcontract Regular time 3 Overtime Subcontract Regular time 4 Overtime Subcontract Requirements Chapter 11 Aggregate Planning and Scheduling
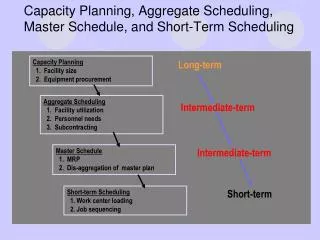
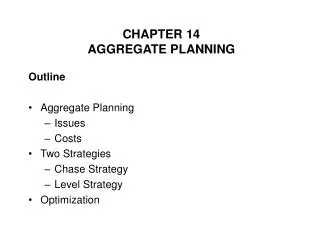
Operations Distribution and marketing Current machine capacities Customer needs Plans for future capacities Demand forecasts Workforce capacities Competition behavior Current staffing level Materials Accounting and finance Aggregate Supplier capabilities Cost data plan Storage capacity Financial condition Materials availability of firm Engineering Human resources New products Labor-market conditions Product design changes Training capacity Machine standards Managerial Inputs Figure 11.1
Aggregate Planning Objectives • Minimize Costs/Maximize Profits • Maximize Customer Service • Minimize Inventory Investment • Minimize Changes in Production Rates • Minimize Changes in Workforce Levels • Maximize Utilization of Plant and Equipment
Aggregate Planning Strategies Possible Alternatives Possible Alternatives Strategy during Slack Season during Peak Season Chase #1: vary workforce Layoffs Hiringlevel to match demand Chase #2: vary output Layoffs, undertime, Hiring, overtime,rate to match demand vacations subcontracting Level #1: constant No layoffs, building No hiring, depletingworkforcelevel anticipation inventory, anticipation inventory, undertime, vacations overtime, subcontracting, backorders, stockouts Level #2: constant Layoffs, building antici- Hiring, depleting antici-outputrate pation inventory, pation inventory, over- undertime, vacations time, subcontracting, backorders, stockouts
Determine requirements for planning horizon Prepare prospective plan for planning horizon Identify alternatives, constraints, and costs No Is the plan acceptable? Yes Move ahead to next planning session Implement and update the plan Aggregate Planning Process Figure 11.2
Aggregate Planning Costs • Regular-time Costs • Overtime Costs • Hiring and Layoff Costs • Inventory Holding Costs • Backorder and Stockout Costs
Dock Aisle TIME PERIOD 1 2 3 4 5 6 Total Requirement* 6 12 18 15 13 14 78 Current employment = 10 part-time clerks Level Strategy for Services * Number of part-time employees • No more than 10 new hires in any period • No backorders are permitted • Overtime can not exceed 20% of regular-time capacity • The following costs can be assigned: • Regular-time wage $2,000/period at 20 hours/week • Overtime wages 150% of regular-time • Hiring $1,000/person • Layoffs $500/person Example 11.1
Dock Aisle TIME PERIOD 1 2 3 4 5 6 Total Requirement* 6 12 18 15 13 14 78 Current employment = 10 part-time clerks Level Strategy for Services Peak Requirement • No more than 10 new hires in any period • No backorders are permitted • Overtime can not exceed 20% of regular-time capacity • The following costs can be assigned: • Regular-time wage $2,000/period at 20 hours/week • Overtime wages 150% of regular-time • Hiring $1,000/person • Layoffs $500/person 1.20w = 18 employees in peak period Example 11.1
Dock Aisle TIME PERIOD 1 2 3 4 5 6 Total Requirement* 6 12 18 15 13 14 78 Current employment = 10 part-time clerks 18 1.20 w = = 15 employees Level Strategy for Services Peak Requirement • No more than 10 new hires in any period • No backorders are permitted • Overtime can not exceed 20% of regular-time capacity • The following costs can be assigned: • Regular-time wage $2,000/period at 20 hours/week • Overtime wages 150% of regular-time • Hiring $1,000/person • Layoffs $500/person 1.20w = 18 employees in peak period Example 11.1
Dock Aisle TIME PERIOD 1 2 3 4 5 6 Total Requirement* 6 12 18 15 13 14 78 Current employment = 10 part-time clerks 18 1.20 w = = 15 employees Level Strategy for Services Peak Requirement • No more than 10 new hires in any period • No back orders are permitted • Overtime can not exceed 20% of regular-time capacity • The following costs can be assigned: • Regular-time wage $2,000/period at 20 hours/week • Overtime wages 150% of regular-time • Hiring $1,000/person • Layoffs $500/person 1.20w = 18 employees in peak period Figure 11.3
Dock Aisle TIME PERIOD 1 2 3 4 5 6 Total Requirement* 6 12 18 15 13 14 78 Current employment = 10 part-time clerks Chase Strategy for Services Figure 11.4
ACCOUNTING PERIOD 1 2 3 4 5 6 Total Requirement* 24 142 220 180 136 168 870 Current employment = 120 workers Mixed Strategies in Manufacturing Figure 11.5 Example 14.3 • No beginning inventory or back orders in period 1 • No stockouts or backlog extensions are permitted • Overtime cannot exceed 20% of regular-time capacity • The following costs can be assigned: • Regular-time production $4,000/employee-period • Overtime production 150% of regular-time • Hires $2,400/person • Layoffs $400/person • Inventory $40/employee-period/period • Back orders $1,000/employee-period/period
Regular-Time Overtime Subcon- Quarter Production Production tracting Total 1 450 90 20 560 2 450 90 200 740 3 750 150 200 1100 4 450 90 110 650 Totals 2100 420 530 3050 Anticipation Inventory Quarter Quantity Example 11.3
Regular-Time Overtime Subcon- Quarter Production Production tracting Total 1 450 90 20 560 2 450 90 200 740 3 750 150 200 1100 4 450 90 110 650 Totals 2100 420 530 3050 Anticipation Inventory Quarter Quantity 1 250 + 560 – 300 = 510 2 510 + 740 – 850 = 400 3 400 + 1100 – 1500 = 0 4 0 + 650 – 350 = 300 Example 11.3