Download

1 / 33
330 likes | 333 Views
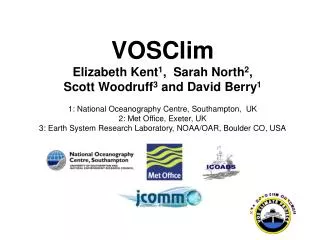
VOSClim Project aims to improve marine weather forecasts by collecting high-quality marine meteorological observations from voluntary observing ships. The project requires additional information about ships to minimize observation errors and enhance climate models.

E N D
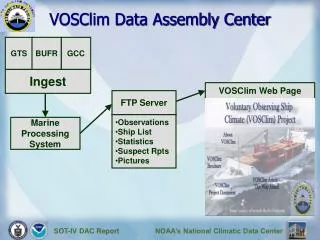
Why do we want the VOSClim information? The purpose of VOSClim Project • To provide a high-quality set of marine met obs • Detailed information on how the data were obtained. • Observations are of great value to operational marine forecasting. • climate studies needs increased accuracy of good observations. • Improved climate models • Better ground truth for checking satellite obs
For VOS-Clim project we request PMO's to collect extra information about the Ships. Why do we want this information?
Observed Field RMS Error: Min. Max. Mean Surface Wind Speed (m/s) 1.3 2.8 2.1 ± 0.2 Pressure (mb) 1.2 7.1 2.3 ± 0.2 Air Temperature (°C) 0.8 3.3 1.4 ± 0.1 Sea Surface Temperature (°C) 0.4 2.8 1.5 ± 0.1 Specific Humidity (g/kg) 0.6 1.8 1.1 ± 0.2 Errors in Ship Obs at present
Why we want to know the dimensions of the ship and the position of the anemometer? The ship disturbs the airflow- the anemometer will not measure the true value that the wind would have if the ship were not there. Using computer models we can calculate the flow around ships and find out how big this error is. Or we can place a model of the ship in a wind tunnel and measure the error for different wind directions.
This is the airflow over a very simplified model of a tanker or bulk ore carrier. It was generated from a computer model. Amongst other factors, the airflow over the wheelhouse depends on: The distance between the main deck and the wheelhouse-top... one of the dimensions that you are being asked to specify for the VOS-Clim project.
Air Temp measurement instrument and it’s situation Night This graph shows the average error in air temperature measurement for thermometer screens on different ships.... the different lines show how well the screen was situated... green = good, blue =moderate, red = bad At night the badly exposed screens were, on average half to one degree too warm.
Air Temp measurement instrument it’s situation Day In sunny conditions all the screens tend to read too warm - but for screens with good or moderate exposure the over-heating is reasonably uniform - we can devise a correction. The screens with bad exposure read much too high - several degrees - and there are big differences between different screens – we can’t correct these errors but it’s important that we should know about them.
Sea surface temperature determination The value of the sea surface temperature (“SST”) depends to some extent on how it is measured. The plot shows the average difference between SST values from Engine Room Intake (“ERI”) thermometers and those from hull contact sensors (dotted line). Bucket readings are close to or slightly colder than the hull contact readings at night. However in the daytime the bucket readings tend to become warmer if the sun is shining.
Volcanic eruption caused SST Mount Pinatubo volcano erupted in June 1991. Large quantities of ash were thrown high into the atmosphere
This ash cloud circled the tropics and caused the satellite sensors to report that the tropical SST was suddenly about 1°C colderthan usual but the ships and buoys showed that really the SST was about 0.5°C warmerthan usual! The graph below shows that it took a whole year for the satellite readings to return to the correct value. Therefore satellite data is always checked against ship & drifting buoy data and corrected as and when necessary before it is used.
There are other problems with satellite data . Satellites may not measure storm force winds correctly, some instruments can not see through clouds or do not provide values close to the sea surface Temp. Despite all the advances in space technology we still need good data from merchant ships!
Remember, if the predictions are correct rising sea level could be catastrophic, for some island states. Storms of increasing frequency and strength would be associated with high winds and more frequent damaging floods. Your observations will help us tell to what extent this is already happening. In fact, we urgently need to understand the climate better . we need high quality data – we are asking you to help!
For the VOS-Clim project we are asking PMO's to collect extra information about the selected Voluntary Observing Ships.
Information we need 1. Vessel Information 2. Vessel Layout 3. Communications 4. Equipment 5. Publications Supplied to Ship 6. Footnotes 7. Comments/Remedial Action 8. Recruiter Identification and Date
Information we need Vessel Information
Information we need Vessel Layout
Information we need Communications
Information we need Equipment
Information we need Publications Supplied to Ship
Benefits to the shipping industry • The VOS-Clim project will help in the development of future marine met systems which are expected to produce better marine weather forecasts • To give ships much more comprehensive real-time weather information for operational purposes. • By participating in the VOS-Clim project the shipping industry will also help us to face the large scale weather changes associated with a changing climate.