Download
1 / 1
10 likes | 260 Views
threshold. Laser OFF. 100. -50. 0. 50. 6nm/diode 30 DFB diodes. Laser diode. Lambdameter. n =f(T,I). Optical isolator. Coupler. AO Modulator. laser ON. Photodiode.

E N D
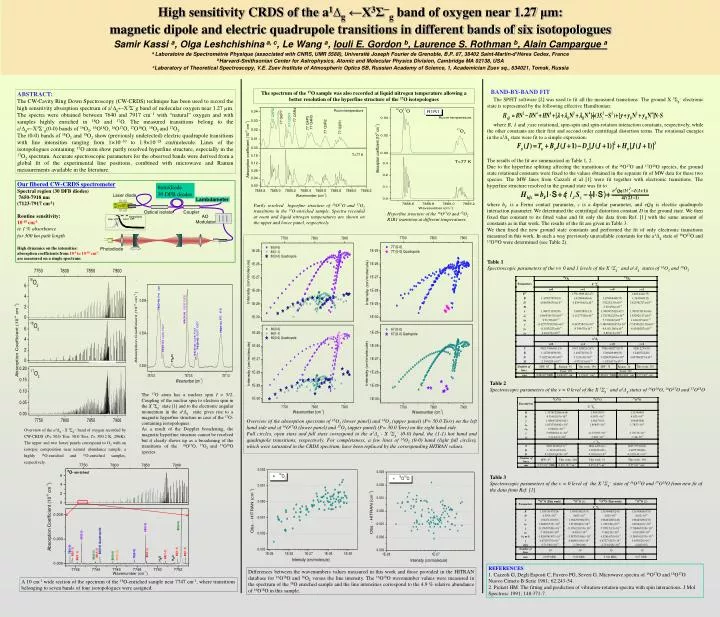
threshold Laser OFF 100 -50 0 50 6nm/diode 30 DFB diodes Laser diode Lambdameter n=f(T,I) Optical isolator Coupler AO Modulator laser ON Photodiode Overview of the absorption spectrum of 16O2 (lower panel) and 18O2 (upper panel) (P= 50.0 Torr) on the left hand side and of 16O17O (lower panel) and 17O2 (upper panel) (P= 30.0 Torr) on the right hand side. Full circles, open stars and full stars correspond to the a1Δg - X 3Σg− (0-0) band, the (1-1) hot band and quadrupole transitions, respectively. For completeness, a few lines of 16O2 (0-0) band (light full circles), which were saturated in the CRDS spectrum, have been replaced by the corresponding HITRAN values. High sensitivity CRDS of the a1∆g ←X3Σ−g band of oxygen near 1.27 μm: magnetic dipole and electric quadrupole transitions in different bands of six isotopologuesSamir Kassi a, Olga Leshchishina a, c, Le Wang a, Iouli E. Gordon b, Laurence S. Rothman b, Alain Campargue aaLaboratoire de Spectrométrie Physique (associated with CNRS, UMR 5588), Université Joseph Fourier de Grenoble, B.P. 87, 38402 Saint-Martin-d’Hères Cedex, FrancebHarvard-Smithsonian Center for Astrophysics, Atomic and Molecular Physics Division, Cambridge MA 02138, USAcLaboratory of Theoretical Spectroscopy, V.E. Zuev Institute of Atmospheric OpticsSB, Russian Academy of Science, 1, Academician Zuev sq., 634021, Tomsk, Russia BAND-BY-BAND FIT The spectrum of the 17O sample was also recorded at liquid nitrogen temperature allowing a better resolution of the hyperfine structure of the 17O isotopologues ABSTRACT: The CW-Cavity Ring Down Spectroscopy (CW-CRDS) technique has been used to record the high sensitivity absorption spectrum of a1∆g←X3Σ−g band of molecular oxygen near 1.27 m. The spectra were obtained between 7640 and 7917 cm−1 with “natural” oxygen and with samples highly enriched in 18O and 17O. The measured transitions belong to the a1∆g←X3Σ−g(0-0) bands of 16O2, 16O18O, 16O17O, 17O18O, 18O2 and 17O2. The (0-0) bands of 16O2 and 18O2 show (previously undetected) electric quadrupole transitions with line intensities ranging from 1×10⁻³⁰ to 1.9×10⁻²⁸ cm/molecule. Lines of the isotopologues containing 17O atom show partly resolved hyperfine structure, especially in the 17O2 spectrum. Accurate spectroscopic parameters for the observed bands were derived from a global fit of the experimental line positions, combined with microwave and Raman measurements available in the literature. The SPFIT software [2] was used to fit all the measured transitions. The ground X 3Σg− electronic state is represented by the following effective Hamiltonian: where B, and are rotational, spin-spin and spin-rotation interaction constants, respectively, while the other constants are their first and second order centrifugal distortion terms. The rotational energies in the a1Δg state were fit to a simple expression: The results of the fit are summarized in Table 1, 2. Due to the hyperfine splitting affecting the transitions of the 16O17O and 17O18O species, the ground state rotational constants were fixed to the values obtained in the separate fit of MW data for these two species. The MW lines from Cazzoli et al [1] were fit together with electronic transitions. The hyperfine structure resolved in the ground state was fit to where bFis a Fermi contact parameter, c is a dipolar parameter, and eQq is electric quadrupole interaction parameter. We determined the centrifugal distortion constant D in the ground state. We then fixed that constant to its fitted value and fit only the data from Ref. [1] with the same amount of constants as in that work. The results of the fit are given in Table 3. We then fixed the new ground state constants and performed the fit of only electronic transitions measured in this work. In such a way previously unavailable constants for the a1Δg state of 16O17O and 17O18O were determined (see Table 2). Our fibered CW-CRDS spectrometer Spectral region (30 DFB diodes) 7650-7918 nm (7123-7917 cm-1) Routine sensitivity: 10-10 cm-1 ie 1 % absorbance for 300 km path length High dynamics on the intensities: absorption coefficients from 10-5 to 10-10cm-1 are measured on a single spectrum Partly resolved hyperfine structure of 16O17O and 17O2 transitions in the 17O-enriched sample. Spectra recorded at room and liquid nitrogen temperatures are shown on the upper and lower panel, respectively. Hyperfine structure of the 16O17O and 17O2 R1R1 transition at different temperatures. Table 1 Spectroscopic parameters of the v= 0 and 1 levels of the X 3Σg−and a1Δgstates of 16O2 and 18O2 Table 2 Spectroscopic parameters of the v = 0 level of the X 3Σg−and a1Δgstates of 16O18O, 16O17O and 17O18O The 17O atom has a nuclear spin I = 5/2. Coupling of the nuclear spin to electron spin in the X 3Σg− state [1] and to the electronic angular momentum in the a1Δg state gives rise to a magnetic hyperfine structure in case of the 17O-containing isotopologues. As a result of the Doppler broadening, the magnetic hyperfine structure cannot be resolved but it clearly shows up as a broadening of the transitions of the 16O17O, 17O2 and 17O18O species. Overview of the a1Δg - X 3Σg− band of oxygen recorded by CW-CRDS (P= 50.0 Torr, 30.0 Torr, T= 300.2 K, 296K). The upper and two lower panels correspond to O2 with an isotopic composition near natural abundance sample, a highly 18O-enriched and 17O-enriched samples, respectively. Table 3 Spectroscopic parameters of the v = 0 level of the X 3Σg−state of 16O17O and 17O18O from new fit of the data from Ref. [1] REFERENCES 1. Cazzoli G, Degli Esposti C, Favero PG, Severi G. Microwave spectra of 16O17O and 18O17O. Nuovo Cimeto B Serie 1981; 62:243-54. 2. Pickett HM. The fitting and prediction of vibration-rotation spectra with spin interactions. J Mol Spectrosc 1991; 148:371-7. Differences between the wavenumbers values measured in this work and those provided in the HITRAN database for 16O18O and 16O2 versus the line intensity. The 16O18O wavenumber values were measured in the spectrum of the 18O enriched sample and the line intensities correspond to the 4.9 % relative abundance of 16O18O in this sample. A 10 cm-1 wide section of the spectrum of the 18O-enriched sample near 7747 cm-1, where transitions belonging to seven bands of four isotopologues were assigned.