Download
1 / 26
260 likes | 539 Views
Edward Ashton. Viewshed Creation: From Digital Terrain Model to Digital Surface Model. History of Viewsheds. What is a viewshed Historical uses Military . Common uses. Modern uses of viewsheds Homeland security Military Commercial Land Use Planning. Problem.

E N D
Edward Ashton Viewshed Creation: From Digital Terrain Model to Digital Surface Model
History of Viewsheds • What is a viewshed • Historical uses • Military
Common uses • Modern uses of viewsheds • Homeland security • Military • Commercial • Land Use Planning
Problem • Intervisibility studies are limited by the dearth of Digital Surface Model (DSM) elevation data. Most publically available DEMs are Digital Terrain Models (DTM). DTM DSM
Project Goals • Overcome limitations of DTM based viewshed • Create DSM from DTM using ancillary data sources • Measure effectiveness of process • Use publically available DEMs for DTM • To include IFSAR and LIDAR where available
Previous Work • Swanson (2003) – Different GIS applications viewshed creation compared to in-situ observation to verify findings
Previous Work • Guth (2009) – Proposed feasibility of using vegetation to increase accuracy of DTM
Previous Work • Fisher (1991), Beaulieu (2007), Anile, Furno, Gallo, Massolo (2003) - Fuzzy Viewsheds
Scope of problem • Viewshed at large and small scale • Level of detail for different applications • Small scale – Earth Curvature, projection • Large scale - Detail • How much detail does scale need? Camera placement vs radar site
DEM Datasources • NED – DTM-Free, quality differs based on how collected (1” ,1/3” and 1/9”) • SRTM – DSM-Free, covers world, 1” and 3” • LIDAR – DTM & DSM-Free (limited availability) – Very expensive, detailed, artifacts, large amount of data • IFSAR – DSM-Expensive, artifacts in DSM • Limitations and pros of each type
DTM DSM • ArcGIS Model Builder • USGS National Elevation Dataset (NED) + vegetation information and man-made structures • National Land Cover Database, Landfire, and National Biomass and Carbon Dataset. • Compare with in-situ observations, LIDAR and IFSAR DSM viewsheds.
DSM Data-NLCD 2001 • 29 landcover categories • Resolution of 302 meters
DSM Data-Land Fire • Wildland fire management • Based off NLCD • No man-made features • Resolution of 302 meters • Vegetation Heights in bins, not absolute values
DSM Data-NBCD • Based on SRTM, NED, Landfire and NLCD-2001 Resolution of 302 meters • Estimate weighted canopy height, biomass, and carbon stock
DSM Data-IFSAR • Resolution of 52 meters • DTM
DSM Data-LIDAR • 0.7 meter ground sample distance • Point cloud DSM&DTM
Software Used • Quick Terrain Modeler • Arcview • Spatial Analyst • Military Analyst
In-Situ observation • Digitize using latest NAIP as basemap Convert to raster used to compare with finished viewsheds • Rules • -possible locations of vehicles or humans • -Vegetation = fuzzy
Locations for studies • Rio Grande Valley, Texas • mean slope under 1% • 130 square miles • 68% cultivated crops and pasture • 18% developed space • 14% undeveloped area.
Locations for studies • Aroostook County, Maine • mean slope about 10% • 120 square miles • 44% cultivated crops and pasture • 6% developed area • 43% forest • 7% undeveloped area
Limitations • The 302 meters resolution of NLCD, Landfire, and NBCD limits the DSMs that can be created • Data was collected circa 2000 • LIDAR data collected 2005-2007 • IFSAR data collected ?? – 5 meter • NAIP imagery collected 2007 for Maine sites, 2008 for Texas Sites
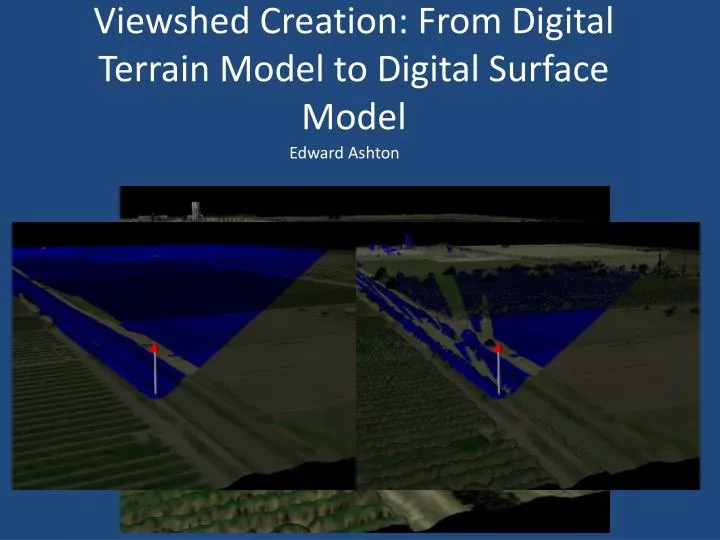
Preliminary Findings • USGS DTM vs. in-situ observation • Lidar DSM vs in-situ observation
Tasks to do • Obtain all the data • Verify Projection, reproject data • Go through methodology steps • Compare results • Repeat process for Maine sites
Predictions/Conclusions • 30 meter data (NLCD, NBCD, Landfire) will yield results that while easy to create will be unsuitable for large scale viewshed in some areas. • IFSAR better results but still issues with artifacting • LIDAR best results but massive amounts of storage space and very expensive to collect and maintain. • Geographic patterns of failure and success