Download
1 / 35
350 likes | 470 Views
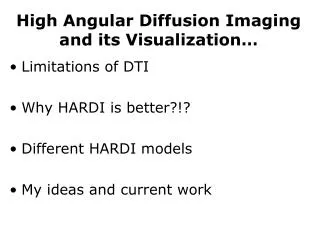
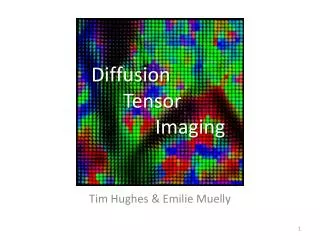
Optimal acquisition s chemes for high angular resolution diffusion imaging. Master thesis by H.C Achterberg Supervised by V. Prčkovska and A. Vilanova In collaboration with A.F. Roebroeck and W.L.P.M. Pullens. Introduction. Fibers elongated cells or threadlike structures

E N D
Optimal acquisition schemes for high angular resolution diffusion imaging Master thesis by H.C Achterberg Supervised by V. Prčkovska and A. Vilanova In collaboration with A.F. Roebroeck and W.L.P.M. Pullens
Introduction • Fibers • elongated cells or threadlike structures • Important information of tissues • Cannot be imaged directly • Image indirect via diffusion / BioMedical Image Analysis
Diffusion • Result of random thermal motion • Described by probability density function • Full PDF: P(r,t) • Gaussian PDF • Partial PDF: P(R0,u) • Measure diffusion • Use a specific MRI method / BioMedical Image Analysis
Diffusion Weighted MRI 90° 180° t RF Gslice Gphase q δ δ Δ Gdiff Gread Signal • two diffusion encoding gradients • b is a combination of new parameters • Signal is complex • Measures diffusion in one direction • Only magnitude is used / BioMedical Image Analysis
Gradient Sampling • Gradient only in one direction • Multiple acquisitions • Amount of gradients • Clinically feasible • Evenly spaced • Static repulsion • Zero gradients / BioMedical Image Analysis
Diffusion reconstruction methods High Angular Resolution Diffusion Imaging Diffusion Spectrum Imaging Diffusion Tensor Imaging Gaussian PDF Only 1 fiber per voxel 6+ directions 3-6 minutes b: between 1000 and 1500 • Full PDF • Multiple fibers per voxel • 200+ directions • 15-60 min • b: up to 8000 • Partial PDF or ODF • Multiple fibers per voxel • 25-121directions • 5-20 min • b: between 1000 and 4000 / BioMedical Image Analysis
Goal Determine which parameters are optimal for a high angular resolution diffusion imaging acquisition / BioMedical Image Analysis
Overview Acquisition Reconstruction Validation Maxima detection • DW-MRI scan • Phantom • In-vivo Q-ball (ODF) Numerical Angular Error DOT (PDF) Analytical Simulation:Multi-tensor Söderman DOT ODF DOT mODF • b-value • gradients • SH order • regularization • Tessellation order Parameters / BioMedical Image Analysis
Simulation data Multi-tensor model Södermans Model Models restricted diffusion Models physical process Slow to compute Parameters fixed D0, ρ, L varying: b, gradients, angle • Models signal as rank-2 tensor • Models signal • Quick to compute • Parameters • fixed λ1,λ2,λ3, • varying: b, gradients, angle / BioMedical Image Analysis
Rician Noise • DW-MRI uses magnitude of complex signal • Gaussian noise on real and complex part • Results in Rician noise • Rician noise is not additive noise • Signal dependant / BioMedical Image Analysis
Overview Acquisition Reconstruction Validation Maxima detection • DW-MRI scan • Phantom • In-vivo Q-ball (ODF) Numerical Angular Error DOT (PDF) Analytical Simulation:Multi-tensor Söderman DOT ODF DOT mODF • b-value • gradients • SH order • regularization • Tessellation order Parameters / BioMedical Image Analysis
How to represent the data? • Show the values on a sphere • Deforms the sphere • Shows orientation better • Not iso-surfaces / BioMedical Image Analysis
How to represent the data? • Show the values on a sphere • Deforms the sphere • Shows orientation better • Not iso-surfaces / BioMedical Image Analysis
About the PDF and ODF Probability Density Function (PDF) Orientation Distribution Function (ODF) Probability on a sphere Radial integral of PDF Only orientational properties of tissue • Probability in 3D space • Micro-scale properties of tissue / BioMedical Image Analysis
Spherical Harmonics • Function on sphere • Ortho-normal basis • Comparable to Fourier series on a sphere • SH have an order • Order dictates detail / BioMedical Image Analysis
Q-ball and DOT Q-ball Imaging Diffusion Orientation Transform Assumes mono-exponential decay Maps apparent diffusion coefficients to probability PDF at radius R0 Uses complex SH basis Finds SH coefficients via integral • No signal decay assumption • Maps signal to ODF • No extra parameters • Uses real SH basis • Find SH coefficients via Least Squares Fit / BioMedical Image Analysis
DOT derived methods • DOT ODF • Inspired by Q-ball • DOT marginal ODF • Inspired by Diffusion Spectrum Imaging • Implemented numerical • Compute number of shells and average • Still need number of R0’s / BioMedical Image Analysis
DOT ODF analytical • Solved radial integral analytical • Similar to Q-ball • Factors for SH coefficients • Eliminate R0 completely / BioMedical Image Analysis
Validation and speed comparison • Validated that DOT ODF approximates true ODF • Artificial signal • Compare with ground truth ODF • Speed comparison • Test computation time per method / BioMedical Image Analysis
Overview Acquisition Reconstruction Validation Maxima detection • DW-MRI scan • Phantom • In-vivo Q-ball (ODF) Numerical Angular Error DOT (PDF) Analytical Simulation:Multi-tensor Söderman DOT ODF DOT mODF • b-value • gradients • SH order • regularization • Tessellation order Parameters / BioMedical Image Analysis
Maxima detection • Reconstruct ODF/PDF • Set threshold • Define isolated regions • Find local maxima in region • Analytical Alternatives / BioMedical Image Analysis
Overview Acquisition Reconstruction Validation Maxima detection • DW-MRI scan • Phantom • In-vivo Q-ball (ODF) Numerical Angular Error DOT (PDF) Analytical Simulation:Multi-tensor Söderman DOT ODF DOT mODF • b-value • gradients • SH order • regularization • Tessellation order Parameters / BioMedical Image Analysis
Angular Error and Tolerance • Discrete sampling • Small errors • Depending on orientation • Use tolerance to compensate / BioMedical Image Analysis
Noiseless results: simulation models / BioMedical Image Analysis
Noiseless results: gradient directions • If gradients increase • Mean error indifferent • Standard deviation decreases / BioMedical Image Analysis
Noiseless results: b-value • Response differs per method • DOT ODF and Q-ball dependant on angle • DOT slightly dependant on angle • DOT marginal ODF independent of angle / BioMedical Image Analysis
Noise added results: SH order Crossing angle 90 degrees Crossing angle 45 degrees / BioMedical Image Analysis
Noise added results: gradient directions / BioMedical Image Analysis
Noise added results: b-values Optimal b-value depends on SNR SNR depends on imaging equipment Create lookup table / BioMedical Image Analysis
Phantom • Created by Pim Pullens • Clinically feasible phantom • Three angles: 30, 50 and 65 / BioMedical Image Analysis
Phantom results • Averaged over 4 voxels • Needs manual registration / BioMedical Image Analysis
Human data • Centrum semioval • Crossing region • Challenging region / BioMedical Image Analysis
Human data results / BioMedical Image Analysis
Conclusion • Optimal acquisition and reconstruction parameters depend on measured structures • The smaller the crossing, the higher SH order required • 90 degrees needs 4th order, 60 degrees needs 6th order and 45 degrees needs 8th order • Number of gradients mostly influences robustness • The improvement are minimal after 97 gradient directions • Optimal b-value dependant on scanning equipment • We create tables to help determine the optimal b-value / BioMedical Image Analysis
Discussion / BioMedical Image Analysis • Phantom need for verification • Only simulation data was quantitative • Maxima detection can be improved • No single optimal set of parameters • Show how to create an optimal scheme