Download
1 / 54
540 likes | 547 Views
Precipitation Climatology of Costa Rica and its Variability. Atmospheric, Oceanic and Topographic Interactions. Two important climatological questions: What drives winds? What makes rain?. 1. Air moves from areas of high atmospheric pressure to areas of low atmospheric pressure. LOW.

E N D
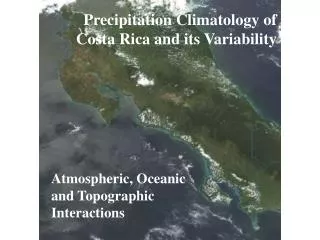
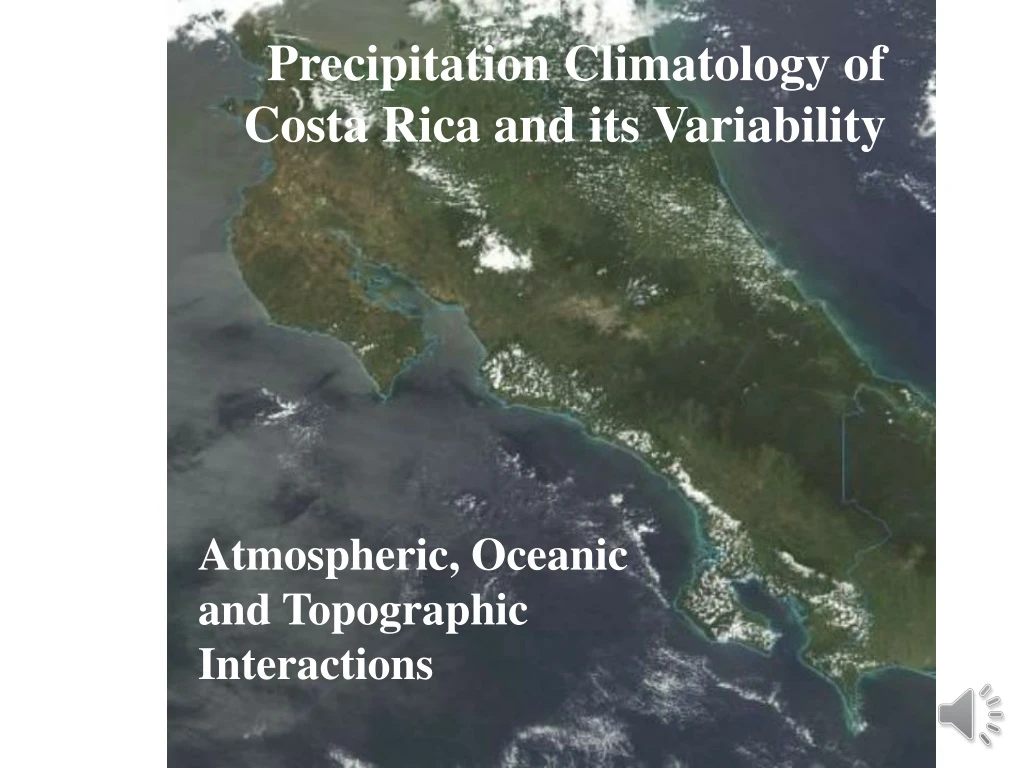
Precipitation Climatology of Costa Rica and its Variability Atmospheric, Oceanic and Topographic Interactions
Two important climatological questions: • What drives winds? • What makes rain?
1. Air moves from areas of high atmospheric pressure to areas of low atmospheric pressure. LOW Intended path Apparent path HIGH 2. Due to the rotation of the Earth, all objects moving across the surface of the Earth in the northern hemisphere appear to be deflected to the right of their intended path. Apparent path Intended path LOW
LOW Intended path In the southern hemisphere the principle remains the same except that winds are deflected to the left of their intended path Apparent path HIGH Apparent path Intended path LOW
Cool 18°F Released condensation 17 g. kg-1 Cool 10°C
Cool 18°F Released condensation 8 g. kg-1 Cool 10°C
Rising air is usually associated with clouds and precipitation as temperatures decline with altitude 1. Make air rise in the atmosphere 2. Temperature and maximum moisture content will decrease
November - April “Los Alisios” – Trade Winds
2. Deflected to the right of their intended path. Winds coming from the northeast 1. Intended path from High at 30°N to Low at the Equator. ~45-60°N ~30°N HIGH HIGH HIGH Northeast Trades LOW LOW LOW ~0° HIGH HIGH HIGH ~30°S Costa Rica ~ 8-11.5°N
STANDARD CLIMATOLOGICAL PICTURE Northeast Trades Caribbean Pacific Andes Equator
2. Upward movement (cooling) of air on side facing the wind (windward) – clouds and rain. Guanacaste Tilarán Central 3. Downward movement (warming) on side away from wind (leeward) - dry. Talamanca 1. Topography of Costa Rica at right angles to Trades. Air forced to rise up and over the cordillera. Source: NASA
(~10°N) Historic average monthly precipitation Topography based on elevation of meteorological station. Pacific Caribbean
Source: Instituto Merteorologico Nacional and Instituto Costarricense de Electricidad
Act 2: May - October “Inter-tropical Convergence Zone – “ITCZ”
~90°N Warm Air Converging And Rising I.T.C.Z. ~30°N HIGH HIGH HIGH Northeast Trades LOW LOW LOW ~0° HIGH HIGH HIGH ~30°S ~90°S
STANDARD CLIMATOLOGICAL PICTURE Northeast Trades 3°N Andes ITCZ Feb Peru- Humboldt Current
STANDARD CLIMATOLOGICAL PICTURE Northeast Trades ITCZ Feb 3°N Andes Cross- Equatorial Westerlies
STANDARD CLIMATOLOGICAL PICTURE Northeast Trades ITCZ Sep 10°N Andes Cross-equatorial Westerlies
Act 3: July - August “Veranillo de San Juan”
VERANILLOS DE SAN JUAN OR CANICULA Mid-Summer Drought Average Latitude (°N) of ITCZ in Eastern Equatorial Pacific Month Hastenrath, 1991
GAP IN CENTRAL AMERICAN CORDILLERA Caribbean warms slowly Caribbean Low Level Jet (CLLJ) Cool Upwelling Northern South America warms quickly
80°W DJF 1000hPa CLLJ NCEP-NCAR RE-ANALYSIS Source: Kalnay et al., 1996 m/s
SEASONAL STRENGTHS OF CLLJ Westerly Component of Wind Velocity at 80°W MAM CLLJ MAM JJA Pressure (mm) ~Altitude Pressure (mm) ~Altitude SON DJF Latitude Latitude Source: NCEP-NCAR Reanalysis, Kalnay et al., 1996
Act 4: November - April “Los Nortes” – Cold Fronts
November – March 3. ~90°N 3. Arctic High pressure strengthens and expands south. HIGH ~45-60°N 4. LOW LOW COLD COLD ~30°N Northeast Trades high high high ~0° LOW LOW LOW 4. Boundary between Arctic and Sub-tropical air migrates south. 2. High pressure at ~30°N weakens and migrates south slightly. 1. ITCZ moves south following the overhead sun.
North America as Funnel of Cold Air in Boreal Winter Rockies etc. H Appalachians Cold air is more dense than warmer tropical air. Drives in like a wedge under the warm air forcing it to rise and produce precipitation. Surges of Cold Air over Gulf of Mexico and Caribbean
STANDARD CLIMATOLOGICAL PICTURE Cold Fronts Northeast Trades Southward moving cold air tries to deflect to right - on-shore and up against topography 3°N Andes ITCZ Feb
Act 4: ENSO “El Niño y La Niña”
STANDARD CLIMATOLOGICAL PICTURE EL NIŇO Northeast Trades 3°N Andes ITCZ Feb Peru- Humboldt Current 1. Warmer surface waters appear in Eastern Equatorial Pacific November onwards
STANDARD CLIMATOLOGICAL PICTURE EL NIŇO Northeast Trades 2. ITCZ shifts south and west of normal position 3°N Andes ITCZ Feb Peru- Humboldt Current 1. Warmer surface waters appear in Eastern Equatorial Pacific November onwards
STANDARD CLIMATOLOGICAL PICTURE EL NIŇO Northeast Trades 3 Northeast Trades intensify 2. ITCZ shifts south and west of normal position 3°N Andes ITCZ Feb Peru- Humboldt Current 1. Warmer surface waters appear in Eastern Equatorial Pacific November onwards
Difference in Velocities (Warm – Cold Phase of ENSO) Positive = More Westerly (Less Easterly) Negative = More Easterly (Less Westerly) MAM Poveda et al., 2001 Spring: “In El Niño, trades weaker (less easterly) than in La Niña.”
Difference in Velocities (Warm – Cold Phase of ENSO) Positive = More Westerly (Less Easterly) Negative = More Easterly (Less Westerly) JJA Poveda et al., 2001 Summer: “In El Niño, trades stronger (less westerly) than in La Niña.”
Difference in Velocities (Warm – Cold Phase of ENSO) Positive = More Westerly (Less Easterly) Negative = More Easterly (Less Westerly) SON Poveda et al., 2001 Fall: “In El Niño, trades stronger (less westerly) than in La Niña, but not as marked as in summer.”
Difference in Velocities (Warm – Cold Phase of ENSO) Positive = More Westerly (Less Easterly) Negative = More Easterly (Less Westerly) DJF Poveda et al., 2001 Winter: “In El Niño, trades much weaker (less easterly) than in La Niña.”
La Niña El Niño Seasonal Precipitation as a Normalized deviate Standard Deviations above/below mean
La Niña El Niño Seasonal Precipitation as a Normalized deviate Standard Deviations above/below mean
La Niña El Niño Seasonal Precipitation as a Normalized deviate Standard Deviations above/below mean
La Niña El Niño Seasonal Precipitation as a Normalized deviate ? Standard Deviations above/below mean
La Niña El Niño Seasonal Precipitation as a Normalized deviate ? Standard Deviations above/below mean
Act 5: Epilogue “The Atlantic”
La Niña El Niño Seasonal Precipitation as a Normalized deviate Standard Deviations above/below mean