Download
1 / 27
550 likes | 3.06k Views
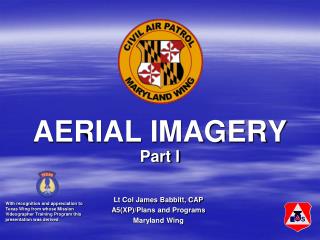
Visual Interpretation of Aerial Imagery Introduction to Remote Sensing GISC 6325 / GEOS 5325 Dr. Stuart Murchison Photointerpreter, Image Analyst Now means interpretation from paper photographs as well as digital images, It is based on a priori knowledge and experience, Deals with:

E N D
Visual Interpretation of Aerial Imagery Introduction to Remote Sensing GISC 6325 / GEOS 5325 Dr. Stuart Murchison
Photointerpreter, Image Analyst • Now means interpretation from paper photographs as well as digital images, • It is based on a priori knowledge and experience, • Deals with: • Sources of Imagery • Elements of Imagery Interpretation • The Applications for Interpretation • Image Interpretation keys • Field Observations • Accuracy Assessments
Visual Interpretation of Fine Resolution Imagery • Usually scale factor is larger that 1:40,000 • Can be Conventional, Digital, or scanned from Analog images • Includes almost all Aerial Photography and fine-scaled imagery from IKONOS, Quickbird, SPOT, Landsat, or IRS satellites • Can be black and white, color, color infrared or multispectral imagery
What Conditions are Advantageous for Analysis of Fine-Resolution Imagery? • Geometrically corrected imagery • Detailed spatial information is visible • Detailed taxonomic levels are discernable • Spatial relationships are between realms or ecotones are seen • Patterns of temporal change are monitored • Proper equipment and experienced staff are available
Sources of Imagery • Archival imagery – Governmental • Canada Centre for Remote Sensing – www.ccrs.nrcan.gc.ca • European Space Agency – www.esa.int/esaCP/index.html • Indian Space Research Org. – www.isro.org or www.nsra.gov.in • NASA – www.gsfc.nasa.gov • NASDA – www.nasda.go.jp/index_e.html • NOAA – www.noaa.gov • USGS – www.usgs.gov
Sources of Imagery • Archival imagery – Commercial • DigitalGlobe – www.digitalglobe.com • ImageSat International – www.imagesatintl.com • Intermap Technologies – www.intermaptechnologies.com • Orbimage – www.orbimage.com • RADARSAT International – www.rsi.ca • Space Imaging – www.spaceimaging.com • SPOT Image – www.spot.com • Terraserver – www.terraserver.com
Custom Image Acquisition • Imagery acquired by date, scale, emulsion, coverage and other characteristics required by customer. • Usually prepare an RFI, RFP, a contract or a “statement of work” that details the project. The following questions are asked • 1. Is this imagery adequate for this project? • 2. Is the film or digital GSD satisfactory? • 3. Is the season suitable? • 4. Is the time of day for acquisition provide proper shadowing? • 5. How much overlap will be needed for stereoscopic viewing?
Elements of Image Interpretation • Shape - refers to the general outline of objects. Regular geometric shapes are usually indicators of human presence and use. Some objects can be identified almost solely on the basis of their shapes: for example - the Pentagon Building, (American) football fields, cloverleaf highway interchanges • Size - The size of objects must be considered in the context of the scale of a photograph. The scale will help you determine if an object is a stock pond or Lake Minnetonka. • Tone - Tone refers to the relative brightness or color of elements on a photograph. It is, perhaps, the most basic of the interpretive elements because without tonal differences none of the other elements could be discerned. • Texture - The impression of "smoothness" or "roughness" of image features is caused by the frequency of change of tone in photographs. It is produced by a set of features too small to identify individually. Grass, cement, and water generally appear "smooth", while a forest canopy may appear "rough".
Elements of Image Interpretation • Shadow - Shadows aid interpreters in determining the height of objects in aerial photographs. However, they also obscure objects lying within them. • Site - refers to topographic or geographic location. This characteristic of photographs is especially important in identifying vegetation types and landforms. For example, large circular depressions in the ground are readily identified as sinkholes in central Florida, where the bedrock consists of limestone. • Association - Some objects are always found in association with other objects. The context of an object can provide insight into what it is. For instance, a nuclear power plant is not (generally) going to be found in the midst of single-family housing. • Pattern - (spatial arrangement) -- The patterns formed by objects in a photo can be diagnostic. Consider the difference between (1) the random pattern formed by an unmanaged area of trees and (2) the evenly spaced rows formed by an orchard.
Elements of Image Interpretation Site Size Shape Tone Pattern Association Texture Shadow
Image Interpretation Tasks • Classification – Assigning Objects to Classes Detection, Recognition and Identification • Enumeration – Lists or Counts of Objects • Measurement – utilizing images to measure lengths, widths, distances and volumes • Delineation – The Demarcations of Regions within the Images
Image Interpretation Strategies • Field Observations – Identification in the field by observation, photography, GPS, etc. • Direct Recognition – Direct recognition intuitiveness • Inference – inference based on knowledge and possible surrogates • Interpretive Overlays – Utilizing addition data in the form of overlays to reveal relationships • Photomorphic Regions – Areas of relatively uniform tone and texture
Image Interpretation Keys • The image interpretation depends on the interpretation keys which an experienced interpreter has established from prior knowledge and the study of the current images. • The eight interpretation elements (shape, size, tone, texture, shadow, site, association and pattern), as well as the time the photograph is taken, season, film type and photo-scale should be carefully considered when developing interpretation keys. Keys usually include both a written and image component.
Aerial Mosaics and Image Maps • Aerial Mosaics – assembling adjacent aerial photographs or digital images to form a single regional view • Uncontrolled Mosaics – assembling adjacent images without strict concern for geometric integrity • Controlled Mosaics – planimetrically correct with all positional errors removed • Aerial Index – images in relative position to be used as a guide • Orthophotos – aerial photos that are planimetrically and geometrically corrected
Aerial Mosaics and Image Maps Aerial Index
Aerial Mosaics and Image Maps Uncontrolled Mosaic
Field Observations and Accuracy Assessment • Field Observations – first-hand observations collected on the ground. Not always possible. • On-screen digitizing – “Head’s up” and on screen digitizing to extract data from imagery. • Accuracy Assessment • Requires reference data (field observations, image keys, etc.) • Compares the reference data with the image data in a matrix • Produces an Error matrix • Errors of omission and commission
Kappa Statistic for Error Matrices • To assess the accuracy of any particular measuring 'instrument', it is usual to distinguish between the reliability of the data collected and their validity. Reliability is essentially the extent of the agreement between repeated measurements, and validity is the extent to which a method of measurement provides a true assessment of that which it purports to measure. When studying the variability of observer categorical ratings, components of possible lack of accuracy must be distinguished.
Kappa Statistic for Error Matrices • The observer disagreement, which is indicated by how observers classify individual subjects into the same category on the measurement scale (Kappa coefficient is one of the most common approaches). In this part, we will focus on the Kappa coefficient (or Kappa statistics). K = observed – expected / 1- expected (meaning that K classification achieced an accuracy that is X% better than would be expected from chance assignment of pixels to categories)
Interpretation Equipment • Magnification – tube magnifiers, binolcular magnifiers, zoom lenses • Flatbed Digital Scanners – scanning densitometers • Light Tables • Densitometers • Stereo Imagery Equipment – stereopairs, stereoscopes, red/blue anaglyph (3D glasses)
Application Examples • Wildlife habitat • Forestry • Environmental Assessment of Waste Disposal Sites • Finding Image Interpretation Services • Engineering, architecture, surveying • Digital orthophotography • Aerial survey, Aerial mapping, Aerial Photography • Digital cartography • Mapping topographical / Mapping GIS