Download
1 / 47
470 likes | 585 Views
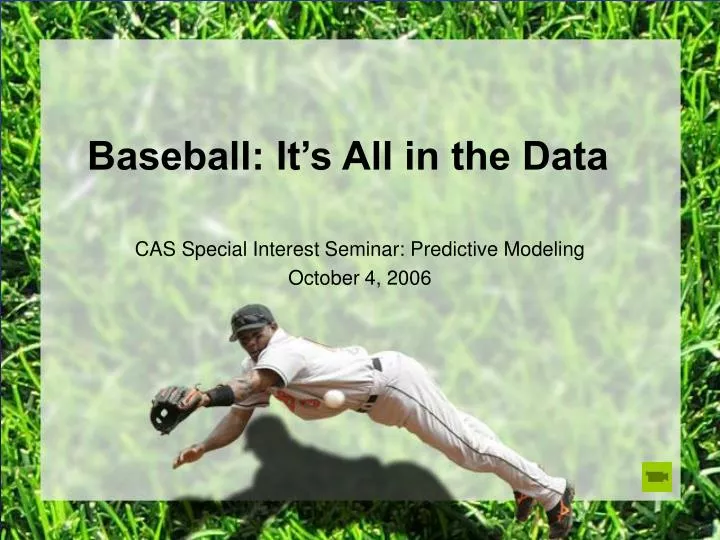
Baseball: It’s All in the Data. CAS Special Interest Seminar: Predictive Modeling October 4, 2006. Not one of these plays was ruled an error. It’s All in the Data. How an actuary got into sports Case study: fielding – the holy grail of baseball statistics Data mining in sports.

E N D
Baseball: It’s All in the Data CAS Special Interest Seminar: Predictive Modeling October 4, 2006
It’s All in the Data • How an actuary got into sports • Case study: fielding – the holy grail of baseball statistics • Data mining in sports
Data is Everywhere • Baseball data is like any other data • Millions of statistics – bottomless pit of numbers • Our job: mine the nuggets that • Are interesting • Are relevant • Reveal tendencies
Danny Cox – 1987 NLCS • STATS, Inc. began pitch-by-pitch tracking • Danny Cox regular season 1987 • First 70 pitches: .268 opponent batting average • Pitch 71+: .345 average • Vin Scully mentions this at pitch 70
What Happened? • 73rd pitch: line-drive double • 74th pitch: long home run to left field • 78th pitch: sharp single to right • 81st pitch: line single to center • 82nd pitch: Vin Scully falls out of the booth
The Dream • Strat-O-Matic Baseball • “Bowie” Dewan • Statistician for the Chicago White Sox • Computerized baseball Information
The Michael Jordan Effect - 1993 1992: STATS tracks basketball Fourth Quarter Comebacks (down 15+ points) • Bulls win NBA crown beating Portland after trailing by 15 entering 4th quarter • How hard is this? • 1992-93 league record: 1-259 (excluding Bulls) • The Bulls? • Bulls record: 3-3 • Jordan leaves Bulls • Bulls record: 0-8 • Jump ahead to comeback season • League record 0-168 (excluding Bulls) • Bulls record 1-1
The First Career • Started as an actuary after college • FSA in 1982 • Head of two Actuarial Departments • I loved what I did! • But sports numbers are more fun than insurance numbers
The Decision • Bill James Baseball Abstract • The dream takes hold • Two full-time jobs • The risk
Bunting: A Lost Skill? • In 2006, Juan Pierre attempted to bunt for a hit 38 times • Was he successful? What’s your guess? • 9 hits (.237 average) • 12 hits (.316) • 16 hits (.421) • 19 hits (.500) The answer is….
Bunting: A Lost Skill? • 19 hits for an amazing .500 average!! • The top bunters hit over .500 • Here is a list of some of the other top bunters from 2006: • Willy Taveras – 21 bunt hits • Corey Patterson – 17 bunt hits • Ryan Zimmerman – 10 bunt hits (10 tries!)
The Second Career • Collect data • Develop products we want ourselves • Money is not the object • Have fun!
The Second Career • Bedroom Office • Key clients: AP, USA Today, ESPN • Growing every year – new office every year • David vs. Goliath – twice! • 100+ Full-Time Employees • Sale to FOX
From The Fielding Bible • Best defensive outfielder in 2005? • Aaron Rowand, Chicago White Sox • Made 15 more plays than an average center fielder • Basic plus/minus +15 • Saving 30 bases for the team • Enhanced plus/minus +30
The Third Career Five different jobs: • Baseball Info Solutions • Stat of the Week (WSCR) • The Fielding Bible • ACTA Sports (publishing) • Camp Dewan • Dewan Foundation • Mission Honduras
Case Study:Enhanced Fielding Analysis • Plus/Minus System(from The Fielding Bible) • Defensive Misplays • Good Fielding Plays • Advanced Catcher Evaluation
Game Charting at BIS • Video scouts review every MLB game • Every play entered into a computer • Sample game scoring screen:
Pixels to Data • 8,000 pixels on the screen • Location of every batted ball converted: • Distance from home plate measured in one-foot increments • One of approximately 260 vectors emanating from home plate
Also Chart: • Velocity of each batted ball (soft, medium, hard) • Type of batted ball (ground ball, line drive, fly ball or popup, bunt) • New for 2006: fliner
The Fielding Bible • Take a step forward in fielding stats • Batting stats • What do you think of when I say a player had 40 HRs – do you get a visual image? • How about 57 stolen bases? • Pitching stats • 39 Saves – tells you something right away • 2.41 ERA – also tells you something • Fielding – what does a .982 fielding percentage mean?
Plus/Minus System • Vector 17 example for shortstops • Softly hit grounders to vector 17 converted to outs by all shortstops 26% of the time • Out made: +.74 (1-.26) • Missed ball: -.26 • Sum every play made or missed by every shortstop
And You Get: • Derek Jeter: -34 in 2005 • Adam Everett: +33 – best in baseball • Juan Uribe: +9 – best in AL • Jeter best in baseball over last three years on balls hit in the air -- +15 • Uribe – Gold Glove That Should Have Been over Jeter
Other Players • Bobby Abreu: –13 in RF • Geoff Jenkins: +13 • Ichiro Suzuki: +48 over last three years • Joe Crede (3B): +11 basic plus/minus • But – Crede only +2 on enhanced plus/minus system • Plays too far off the line: • To his right –14, straight on +16, to left +11
Overall • Eight of ten best teams in Top Nine • Only Yankees and Red Sox made playoffs without a top defense • Yanks – worst in baseball in 2005 –minus 164 as a team! • The first two subscribers to our newest defensive service? • Yanks and Red Sox
Defensive Misplays • Plays that are NOT recorded as errors or passed balls • Loss of an opportunity to make an out… • …OR an extra advancement by a runner • 54 different types of Defensive Misplays
Defensive Misplays • Slow to recover • Failing to cover first • Cutting off a better positioned fielder • Throw toward wrong base
Good Fielding Plays • Fielder records an out when the play seemed more likely to be a hit… • …OR a fielder prevents the opportunity for advancement of baserunners. • 27 different types of GFPs
Good Fielding Plays • Robs home run • Ground ball out • Fly ball or line drive out • Holds to single • Multiple on one play
Player Breakdown Edgar Renteria and the Terrible, Horrible, No Good, Very Bad Fielding Season….. • Renteria made one third of all Red Sox Infielder misplays in 2005. He had 42, the rest of the infield had 83 combined. • Renteria booted 32 grounders (20 Misplays and 12 Errors). • Edgar made 20 bad throws (10 Misplays and 10 Errors). • Renteria also dropped 7 pop ups, botched 3 double Plays, and failed to tag a runner 7 times.
Data Mining in Sports • Revolution in Major League Baseball • Combining sabermetrics with scouting • Finally! • Moneyball by Michael Lewis • Billy Beane finds a statistical edge • Deification of Bill James • Finally!
The Lead-off Man • Should your lead-off hitter be: • Player A with 5 stolen bases • Player B with 57 stolen bases • On-base percentage • Player A has a .379 on-base percentage • Player B has a .336 on-base percentage • Old school: speed wins out
The Greek God of Walks • Kevin Youkilis is Player A, the on-base guy • Coco Crisp is Player B, the speedy guy • The Red Sox buck tradition • Red Sox record with Crisp at lead-off:24 wins, 31 losses • Youkilis batting lead-off:55 wins, 40 losses
Player Stats Projections • Hitters peak at age 26 and age 27 • Pitchers -- age not much of a factor • Each statistic is individually projected • batting eye improves with age • Past ERA is not the best predictor for future ERA
BIS Infield-D Software Bobby Abreu vs right-handed pitchers
BIS Outfield-D Software Bobby Abreu vs right-handed pitchers
Super Bowl Prediction • 12 Predictive Statistics • Each one predicts the Super Bowl winner 55-71% of the time • A couple examples: • Fewer points allowed – team wins 71% • Less passing yardage – team wins 60% • Taken together, correctly predicted 14 of the last 16 Super Bowls
Heating Up Home Runs per Game by Temperature TemperatureHR/G 49 or less 1.74 50 – 59 1.97 60 – 69 2.03 70 – 79 2.07 80 – 89 2.16 90 or more 2.41
MPH vs. ERA • Does velocity translate to success? • Regular season: Fastball Velocity vs ERA MPHERA Less than 90 4.58 90 to 93 4.29 94 or more 3.84
MPH vs. ERA - Playoffs • More dramatic in the playoffs • Playoffs (last four years): Fastball Velocity vs ERA MPHERA Less than 90 4.71 90 to 93 4.18 94 or more 3.42
BATS Software Carlos Beltran vs fastballs from left-handers
BATS Software Carlos Beltran vs breaking balls from left-handers
Three Data Principles • Look for data where it’s unexpected • Don’t be afraid to collect new data • The more detailed the better
Three Career Principles • Strive for excellence • Money is not the primary motive • Enjoy what you are doing!