Download
1 / 64
690 likes | 827 Views
Network Scale-Up to Estimate the Population Size of High-Risk Groups for HIV. Methods Core Seminars – Center for AIDS Prevention Studies/UCSF – 20 Sep. 2013. Ali Mirzazadeh MD. MPH. PhD.

E N D
Network Scale-Up to Estimate the Population Size of High-Risk Groups for HIV Methods Core Seminars – Center for AIDS Prevention Studies/UCSF – 20 Sep. 2013 Ali MirzazadehMD. MPH. PhD. Institute for Health Policy Studies / Global Health Sciences InstituteUCSF, San Francisco, CA, USA [ali.mirzazadeh@ucsf.edu] Regional Knowledge Hub, and WHO Collaborating Center for HIV Surveillance, Kerman University of Medical Sciences, Kerman, Iran [ali.mirzazadeh@hivhub.ir]
This presentation has the following parts • P1: PSE methods overview • P2: Network Scale-up method overview • P3: Network size estimation • P4: Correction for biases in NSU
Part 1 PSE methods overview
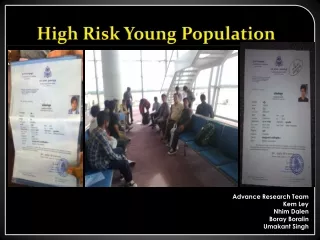
Why do MARP size estimates? • Know, track, and predict your epidemic • Disproportionate impact in low level, concentrated, and generalized epidemics • Program planning • Advocacy, development, M&E • Because you were asked to • UNAIDS, UNGASS, PEPFAR, MOH • Resource allocation • Right population, right priority, right amount on right programs
How to do MARP size estimates? • There is no gold standard, no census • We do not know which method is best • We are not able to fully calibrate or correct • Many methods Scientific rigor Cost
Census Done in surveys of the general population Population-based survey Network scale up Oil wells Multiple sample recapture Done with surveys of MARPs Capture-recapture Plant recapture Unique object multiplier Truncated Poisson Multipliers, multiple multipliers Scientific rigor Unique event multiplier Mapping with census and enumeration Nomination counting Place, RAP, ethnography Registries, police, SHC, drug treatment, unions, workplace Wisdom of the crowds Delphi Consensus Done by literature review, experts, stakeholders, models Discrepancies Soft modeling Borrow from thy neighbor Conventional Wisdom Straw man Cost
Direct Methods Done with surveys of MARPs
Direct questions to population-based surveys • Mirzazadeh A, Haghdoost AA, Nedjat S, Navadeh S, McFarland W, Mohammad K. Accuracy of HIV-Related Risk Behaviors Reported by Female Sex Workers, Iran: A Method to Quantify Measurement Bias in Marginalized Populations. AIDS Behav. 2013 Feb;17(2):623-31
Census and enumeration • Ali Mirzazadeh, Faran Emmanuel, FouziaGharamah, Abdul Hamed Al-Suhaibi, HamidrezaSetayesh, Willi McFarland, Ali Akbar Haghdoost; HIV prevalence and related risk behaviors in men who have sex with men, Yemen 2011; AIDS Behav. 2013 Jul 23. [Epub ahead of print]
Nomination method S Navadeh, A Mirzazadeh, L Mousavi, AA Haghdoost, N Fahimfar, A Sedaghat; HIV, HSV2 and Syphilis Prevalence in Female Sex Workers in Kerman, South-East Iran; Using Respondent-Driven Sampling Iran J Public Health. 2012 Dec 1;41(12):60-5. Print 2012.
Multiplier methods STI Clinic • Johnston LG, Prybylski D, Raymond HF, Mirzazadeh A, Manopaiboon C, McFarland W. Incorporating the Service Multiplier Method in Respondent-Driven Sampling Surveys to Estimate the Size of Hidden and Hard-to-Reach Populations: Case Studies From Around the World Sex Transm Dis. 2013 Apr;40(4):304-10
Indirect Methods Done in surveys of the general population
Proxy respondent method Proxy Respondent (Alter) Respondent Member of Hidden Pop. Mirzazadeh A, Danesh A, Haghdoost AA. Network scale-up and proxy respondent methods in prisons [ongoing]
Network scale-up Shokoohi M, Baneshi MR, Haghdoost AA. Size Estimation of Groups at High Risk of HIV/AIDS using Network Scale Up in Kerman, Iran.Int J Prev Med. 2012 Jul;3(7):471-6.
Part 2 NSU method overview
NSU Basic Concepts • A random sample of the general population describes their social networks • network sizes (C) • the presence of individuals belonging to special sub-populations of interest • Based on the prevalence and presence of sub-populations in the social network of the selected sample, the sizes of the hidden sub-populations in a community are estimated.
NSU – Main Questions • How many people do you know over the past two years? • Of those, how many injected drug (over the past two years)? • Do you know at least one person in your network who injected drug (over the past two years)?
NSU – Frequency Approach • T= total population with the size of t • C= one individual’s acquaintances (or personal network size) • m = the number of individuals belonged to the target population among those acquaintances • E = the hidden population with the size of e
NSU – Probability Approach Probability Approach Frequency Approach
Confidence Interval 95% - Conventional • Frequency approach: • Point Estate E = P x t • 95%CI Upper Limit E = (P + 1.96 se) x t • 95%CI Lower Limit E = (P - 1.96 se) x t
Size Estimation of Groups at High Risk of HIV/AIDS using Network Scale Up in Kerman, Iran Kerman T = 132,651 Age 15-45 Male Shokoohi M, Baneshi MR, Haghdoost AA. Size Estimation of Groups at High Risk of HIV/AIDS using Network Scale Up in Kerman, Iran.Int J Prev Med. 2012 Jul;3(7):471-6.
Seems to be easy / but challenging • What do you mean by ‘know’? • Subgroups (Sex, Age Groups, Local/National)? • How to define MARPS (IDU, FSW, MSM)?
Part 3 Network size estimation
Definition of social network • Global network • Active network • Supportive network • Sexual network • Sub-networks • Family • Coworkers • Classmates • Sport • …
Definition of “know” • People whom you know and who know you, in appearance or by name, with whom you can interact, if needed. AND • With whom you have contacted over the last two years in person, or by telephoneor e-mail AND • Living in your area/country AND • ………..
Direct methods • Overall question? How many do you know? • Active network • Supporting network • Sub-networks • Sub-groups (summation method) • Family • Coworkers • Sports • Ex-classmates • Clubs • Church • ……..
Disadvantages of direct methods • Reliability and validity issue • Double counting in summation method
Indirect methods • C is estimated based on the frequency of members belonging to a sub-populations with known sizes (reference groups): • Number of birth in last year • Number of death due to cancer/car accident in last year • Number of marriage in last year • Number of people with specific first name • It is a type of back calculation
Specific criteria for reference groups • Prevalence between 0.1-4% • one-syllable name • Stable prevalence over time and in different ethnicities
Back calculation of the size of reference groups • At least 20 reference groups are needed in the first step • Some of these reference group may generate bias estimates • Step by step, non-eligible reference groups has to be detected and dropped form the calculation: • Ratio Method • Regression Method
Ratio method algorithm • Step 1: including all reference groups, calculate C • Step 2: back-calculate the size of all reference groups (given C) • Step 3: calculate bias ratio [(Real size/Estimated size)–1] for every reference group • Step 4: exclude the most biased reference group, and recalculate C • Step 5: back-calculate the size of all remaining reference groups (given new C) • Step 6: recalculate bias ratio for every reference group • Step 7: check if all bias ratios are between 0.5 and 1.5 • Step 8: if not, got to step 4 and continue till all bias ratios fall between 0.5 and 1.5
Computer Lab 1 Calculate the network size C_estimation(withoutsolution).xml
Ratio Method – Kerman NSU Plot real versus predicted size of reference groups
Regression Method • NSU assumes a linear association between prevalence of reference groups in the society (e/t) and average number of people respondents knew in each reference group (Average of m) • To detect reference groups that does not satisfy the linearity assumption, fit a regression line and calculate standardize DFBETA for all reference groups. • The reference group with the highest SDFBETA is excluded. • The process is continued in an iterative fashion to remove all reference groups with SDFBETA higher than 3/√n (n is the number of reference groups)
Regression Method – Iran NSU id propmmeanm _dfbeta_1 m1 .015655 1.75703 .9383446 m2 .006402 2.00512 -.1981893 m3 .008163 2.61893 -.6207414 m4 .003383 1.70077 -.2671462 m5 .011498 2.1509 .3982361 m6 .001836 .506394 -.014008 m7 .008614 1.09974 .0457343 m8 .008182 .624041 -.2765261 m9 .003746 .910486 -.0042227 m10 .000292 .450128 .062993 m11 .000259 .329923 .0412282 m12 .000311 1.43478 -.2617438 m13 .002769 1.34271 -.0880711 m14 .000497 .381074 .0366919 m15 .000839 .731458 .050291 m16 .005542 1.2046 .0195055 m17 .001603 .557545 .009407 m18 .00334 .867008 -.0029265 m19 .000204 .283887 .0327013 m20 .000866 .754476 .0480117 m21 .000148 .242967 .0244004 m22 .001088 .703325 .043369 m23 .000988 .506394 .0317765 • STATA commands: regmeanmpropm, beta dfbeta disp 3/sqrt(23)
Real vs. Predicted SizeRatio and Regression Methods Final Network Size Ratio M. 380 Regression M. 308 Glob J Health Sci. 2013 Jun 17;5(4):217-27. doi: 10.5539/gjhs.v5n4p217. The estimation of active social network size of the Iranian population. Rastegari A, Haji-Maghsoudi S, Haghdoost A, Shatti M, Tarjoman T, Baneshi MR.