Download

1 / 44
440 likes | 577 Views
Microarray Design with an Illumina focus. Andy Lynch 23/07/08. Overview. The BeadArray Technology Sources of variance Bead-level data Prior information Specific experiment types Reasons for choosing ‘sub-optimal’ designs Closing thoughts. The Technology. The Bead.

E N D
Microarray Design with an Illumina focus Andy Lynch 23/07/08
Overview • The BeadArray Technology • Sources of variance • Bead-level data • Prior information • Specific experiment types • Reasons for choosing ‘sub-optimal’ designs • Closing thoughts
The Bead Complementary RNA with dye attached UUGCAUAUGCUGAUAGCACAUGUCAUAUCG BEAD AACGTATACGACTATCGTGTACAGTATAGC bases used to identify the bead-type 50 bases that target the RNA (for example) of interest Each silica bead is 3 microns in diameter 700,000 copies of same probe sequence are covalently attached to each bead for hybridisation & decoding
Human expression beadchips HumanRef-8 8 Parallel Arrays on the chip Each Array has ~24,000 'high-quality' RefSeq derived probes Approx 30 copies of each bead type HumanWG-6 V1 6 Parallel Arrays on the chip, each consisting of 2 parallel strips Strip 1 has the ~24,000 RefSeq derived probes Strip 2 has ~24,000 other probes (some RefSeq derived) Approx 30 copies of each bead type
Human expression beadchips HumanWG-6 V2, V3 6 Parallel Arrays on the chip, each consisting of 2 parallel strips Each strip has ~48,000 probes Approx 30 copies of each bead type HumanHT-12 12 Parallel Arrays on the chip consisting of 1 strip Each strip has ~48,000 probes* Fewer copies (?~15) of each bead type
Control beads Many negative controls ~1000 depending on chip-type - each with replicates Some house-keeping, biotin, and “high stringency” controls Labelling controls (may not be used) Some perfect-match/mis-match pairs (useless in HumanWG 6 V3) Some general hybridization controls
SAMS Each array on the end of a fibre-optic cable 96 arrays in a module Each array has about 1500 probe-types about 30 replicates of each Used for specialist probe panels can be custom made Often used for two-colour work Used for genotyping, allele specific expression, methylation, expression (esp with poor quality RNA) and microRNAs
The process Beads are allocated at random to the wells Presumed independently Address sequences are used to identify the beads - Some beads will fail to be identified Presume this is independent of bead-type Array rejected if not all beadtypes are present in suitable numbers - Applies to HumanWG 6 and HumanRef 8 - At least 5 replicates on the array? - Seems to have at least one bead on each strip of two strip arrays Sample hybridized to array Can either return “bead-level” intensities/locations or Illumina summaries
Illumina Summaries For each bead type… …on the original (i.e. non-logged) scale… … outliers are removed (>3 MAD from the median) … number of beads is reported … mean intensity … s.e. of intensity … p-value for comparison with negative controls
Illumina Summaries For two-colour platforms we may wish to then calculate… … log-ratio (log(R/G)) … beta (R/(R+G)) … sum (R+G) … theta (2*arctan(R/G)/π) However we can’t get very good estimates of the confidence in these values since the covariance of the red and the green signals is not reported in the summary information.
Substructures Strip segment The strips that make up one or half of one array themselves consist of 9 sub-sections (segments) Probably shouldn't treat an array as 18 technical replicates, but need to be aware of the issue Strip Array
Substructures The 96 arrays in a SAM are arranged in a 12x8 layout Each individual array consists of an approximate hexagon of 49,777 beads arranged in 547 hexagons of 91 beads 14-> 27-> 14-> 547 sub-units 91 beads
Differences between probes • Not all probes are equally well designed • There are thermodynamic differences between probes • The additional probes on the HumanWG6 arrays are a-priori less likely to see expression • Some probes contain SNPs, mismatches, splice junctions etc • Some probes target the 3’ end of a gene some the 5’ end • Some probes have multiple matches in the transcriptome others have no good match
Sources of variation • Variation enters at many levels bead < probe < strip < array < chip • Random numbers of beads mean that some arrays provide more evidence than others
Sources of variation • Differences between chips (as expected) • Gradients within chips (widely reported) • known that there is a between array gradient • also a perpendicular (along array) gradient in many chips • not observable with summary data • Quality of final array on chip has been questioned on occasion • Differences between strips • not surprising given the gradient • not observable with summary data
Bead-Level Data • As an alternative to the summary data • can obtain bead level data, • or the raw images and a list of bead locations and identities • Need to adjust the scanner settings to achieve this • The beadarray bioconductor package is available to handle the data
Bead-Level Advantages • Can perform better quality control • Can rescue arrays/strips that might otherwise need to be discarded
Bead-Level Advantages • Can separate the two strips • Either normalize them while combining • Or take two technical replicates • Can analyse the data on the scale of our choice • Usually log • Includes outlier removal • For two-colour arrays, can calculate standard errors of beta, theta etc.
Eliciting prior information • Default ‘LIMMA’ analysis returning the log-odds of being differentially expressed essentially assumes a uniform prior for the probes • Certainly with the HumanWG-6 the refseq and non-refseq probes would have different a priori odds • May wish to elicit more specific priors, but can’t get 48,000! • Priors by pathway?
Eliciting prior information • While we are about it, can try to gauge • Which contrasts are more important? • Which ‘treatments’ are expected to be similar?
Summary • Not all arrays will provide equal amounts of evidence • Numbers of beads will vary from chip to chip • Some 'arrays' may provide no evidence for certain probe types • In HumanWG 12 this is a 'feature‘ • In HumanWG 6 V2/3 may result from treating the two strips as technical replicates • May result from excising part of the array in quality control • Block designs required • may need to consider blocks of 6, 8, or 12 • Need to know if we will have raw or summarized data
First design question • If using Illumina for expression, which array to use? • The 6 has extra probes (but these just as likely to hinder) and is expensive • The 8 only has good quality probes, is cheaper, but lacks some probes on the 6 • The 12 is cheapest, but risks having no or few beads for some probes
Platform Comparison Studies • E.g. MAQC (nature biotech, 2006, 24 1140-1150) • How do you decide on the number of arrays to compare? • How do you choose an analysis method that isn’t biased towards one of the platforms?
Platform Evaluation • How do we determine absolutely the performance of a platform? • Titration series? (e.g. BMC Bioinformatics, 2006, 7, 511) • What levels of dilution? • Spiked-in probes? (e.g. Affymetrix Latin Square data for expression algorithm assessment 2001) • How many and at what levels?
Logical experiments • Often want to find genes that show up with one treatment but not another • Extreme example is identification of siRNA offtargets as in Nature Methods (2006) 3 199-204 • They had 4 siRNAs with the same target and replicates for each. • The question is what genes are differentially expressed only by one siRNA? • Need to weigh up number of alternative treatments, FPR, FNR, and number of biological replicates
Time Series • Choice of time points • Replicate the same time points or intervening ones? • Control series? • Same time points? • Cell cycle?
Robustness • Quite common to design experiments to be robust to losing a single array • Now, may need to be robust to losing a chip • In SAM experiments, may need to be robust to losing the edge rows and columns. • Can cause tension if there is a shortage of samples for some treatments
Validation • May want to sacrifice the ability to estimate our quantity of interest in order to be able to evaluate performance • For classifications such as CNV calls might want to include a series of many replicates • Can estimate false calling rates by analysis of the consistency of calls within the replicates
Validation • Some genomic information (SNPs, CNVs etc.) we expect to be inherited at a certain rate. • Inclusion of pedigrees can allow estimation of inheritance rates • Discrepancies between the expected and observed rates can allow for estimation of the false calling rates
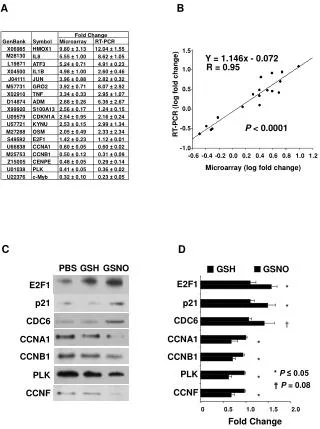
Validation • The gold standard of validation is to use a lower-throughput, high performance, technology such as RTPCR • Expensive to do, can only validate a small subset of probes • Need to choose which ones • Need to decide how many • The more we anticipate running, the fewer the number of microarrays we can have
Other… • May wish to include arrays that • allow for ongoing QC of the microarray facility • gain information to facilitate planning future experiments • ‘complete’ the data set for future data mining
A A A B B B F F F C C C D D D E E E Thoughts • If we are concerned about the block effects, we might want to construct log-ratios within chips • Can even split the two strips • If we could successfully control for block effects and batch effects then sequential designs would potentially play a role
Acknowledgements Thanks to: Mark Dunning, Matt Ritchie, Nat Thorne for slides Illumina for some of the pictures Ian Mills, Charlie Massie, Mahesh Iddawela for some of the illustrative data