Download
1 / 1
10 likes | 446 Views
69. 75. 12. 90. 76. 23. 41. 99. 2. 4. 60. 29. 92. 19. 45. 57. 87. 48. 66. 7. Point = GS/5. 20. 80. 40. 10. 79. 88. 33. 78. 21. 83. Land Management and Natural Hazards Unit. 54. 15. 67. 51. 37. 16. 44. 93. 28. 98. 64. 32. 95. 47. 9. 24. 58. 8. 71.

E N D
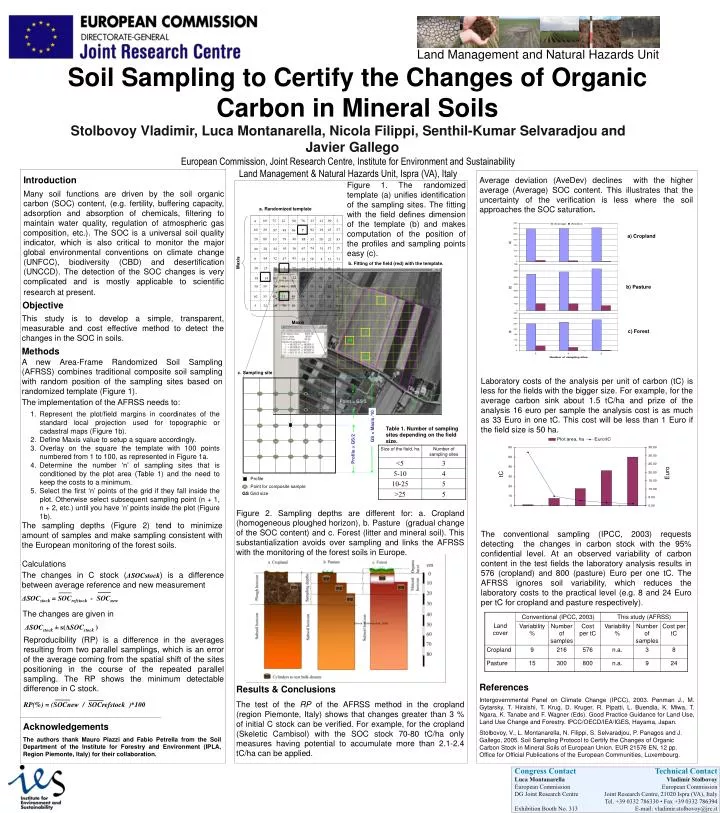
69 75 12 90 76 23 41 99 2 4 60 29 92 19 45 57 87 48 66 7 Point = GS/5 20 80 40 10 79 88 33 78 21 83 Land Management and Natural Hazards Unit 54 15 67 51 37 16 44 93 28 98 64 32 95 47 9 24 58 8 71 53 Maxis GS = Maxis /10 1 25 56 72 38 91 70 18 43 97 22 94 42 34 14 68 85 17 74 59 Profile = GS/2 100 30 39 49 31 35 73 61 82 3 62 55 63 84 50 11 46 27 96 65 36 89 5 52 6 66 26 77 13 81 Profile Maxis Point for composite sample GS Grid size Introduction Many soil functions are driven by the soil organic carbon (SOC) content, (e.g. fertility, buffering capacity, adsorption and absorption of chemicals, filtering to maintain water quality, regulation of atmospheric gas composition, etc.).The SOCis a universal soil quality indicator, which is also critical to monitor the major global environmental conventions on climate change (UNFCC), biodiversity (CBD) and desertification (UNCCD). The detection of the SOC changes is very complicated and is mostly applicable to scientific research at present. Objective This study is to develop a simple, transparent, measurable and cost effective method to detect the changes in the SOC in soils. a) Cropland Methods b) Pasture A new Area-Frame Randomized Soil Sampling (AFRSS) combines traditional composite soil sampling with random position of the sampling sites based on randomized template (Figure 1). The implementation of the AFRSS needs to: • Represent the plot/field margins in coordinates of the standard local projection used for topographic or cadastral maps (Figure 1b). • Define Maxis value to setup a square accordingly. • Overlay on the square the template with 100 points numbered from 1 to 100, as represented in Figure 1a. • Determine the number ‘n’ of sampling sites that is conditioned by the plot area (Table 1) and the need to keep the costs to a minimum. • Select the first ‘n’ points of the grid if they fall inside the plot. Otherwise select subsequent sampling point (n + 1, n + 2, etc.) until you have ‘n’ points inside the plot (Figure 1b). c) Forest tC Euro The sampling depths (Figure 2) tend to minimize amount of samples and make sampling consistent with the European monitoring of the forest soils. The changes in C stock (ΔSOCstock) is a difference between average reference and new measurement ΔSOCstock = SOCrefstock - SOCnew The changes are given in ΔSOCstock ± s(ΔSOCstock ) RP(%) = (SOCnew / SOCrefstock )*100 Congress Contact Luca Montanarella European Commission DG Joint Research Centre Exhibition Booth No. 313 Technical Contact Vladimir Stolbovoy European Commission Joint Research Centre, 21020 Ispra (VA), Italy Tel. +39 0332 786330 • Fax +39 0332 786394 E-mail: vladimir.stolbovoy@jrc.it Soil Sampling to Certify the Changes of Organic Carbon in Mineral Soils Stolbovoy Vladimir, Luca Montanarella, Nicola Filippi, Senthil-Kumar Selvaradjou and Javier Gallego European Commission, Joint Research Centre, Institute for Environment and Sustainability Land Management & Natural Hazards Unit, Ispra (VA), Italy Average deviation (AveDev) declines with the higher average (Average) SOC content. This illustrates that the uncertainty of the verification is less where the soil approaches the SOC saturation. Figure 1. The randomized template (a) unifies identification of the sampling sites. The fitting with the field defines dimension of the template (b) and makes computation of the position of the profiles and sampling points easy (c). a. Randomized template b. Fitting of the field (red) with the template. c. Sampling site Laboratory costs of the analysis per unit of carbon (tC) is less for the fields with the bigger size. For example, for the average carbon sink about 1.5 tC/ha and prize of the analysis 16 euro per sample the analysis cost is as much as 33 Euro in one tC. This cost will be less than 1 Euro if the field size is 50 ha. Table 1. Number of sampling sites depending on the field size. Figure 2. Sampling depths are different for: a. Cropland (homogeneous ploughed horizon), b. Pasture (gradual change of the SOC content) and c. Forest (litter and mineral soil). This substantialization avoids over sampling and links the AFRSS with the monitoring of the forest soils in Europe. The conventional sampling (IPCC, 2003) requests detecting the changes in carbon stock with the 95% confidential level. At an observed variability of carbon content in the test fields the laboratory analysis results in 576 (cropland) and 800 (pasture) Euro per one tC. The AFRSS ignores soil variability, which reduces the laboratory costs to the practical level (e.g. 8 and 24 Euro per tC for cropland and pasture respectively). Calculations Source: Stolbovoy et al., 2006 Reproducibility (RP) is a difference in the averages resulting from two parallel samplings, which is an error of the average coming from the spatial shift of the sites positioning in the course of the repeated parallel sampling.The RP shows the minimum detectable difference in C stock. References Intergovernmental Panel on Climate Change (IPCC), 2003. Penman J., M. Gytarsky, T. Hiraishi, T. Krug, D. Kruger, R. Pipatti, L. Buendia, K. Miwa, T. Ngara, K. Tanabe and F. Wagner (Eds). Good Practice Guidance for Land Use, Land Use Change and Forestry. IPCC/OECD/IEA/IGES, Hayama, Japan. Stolbovoy, V., L. Montanarella, N. Filippi, S. Selvaradjou, P. Panagos and J. Gallego, 2005. Soil Sampling Protocol to Certify the Changes of Organic Carbon Stock in Mineral Soils of European Union. EUR 21576 EN, 12 pp. Office for Official Publications of the European Communities, Luxembourg. Results & Conclusions The test of the RP of the AFRSS method in the cropland (region Piemonte, Italy) shows that changes greater than 3 % of initial C stock can be verified. For example, for the cropland (Skeletic Cambisol) with the SOC stock 70-80 tC/ha only measures having potential to accumulate more than 2.1-2.4 tC/ha can be applied. Acknowledgements The authors thank Mauro Piazzi and Fabio Petrella fromthe Soil Department of the Institute for Forestry and Environment (IPLA, Region Piemonte, Italy)for their collaboration.