Download
1 / 1
10 likes | 110 Views
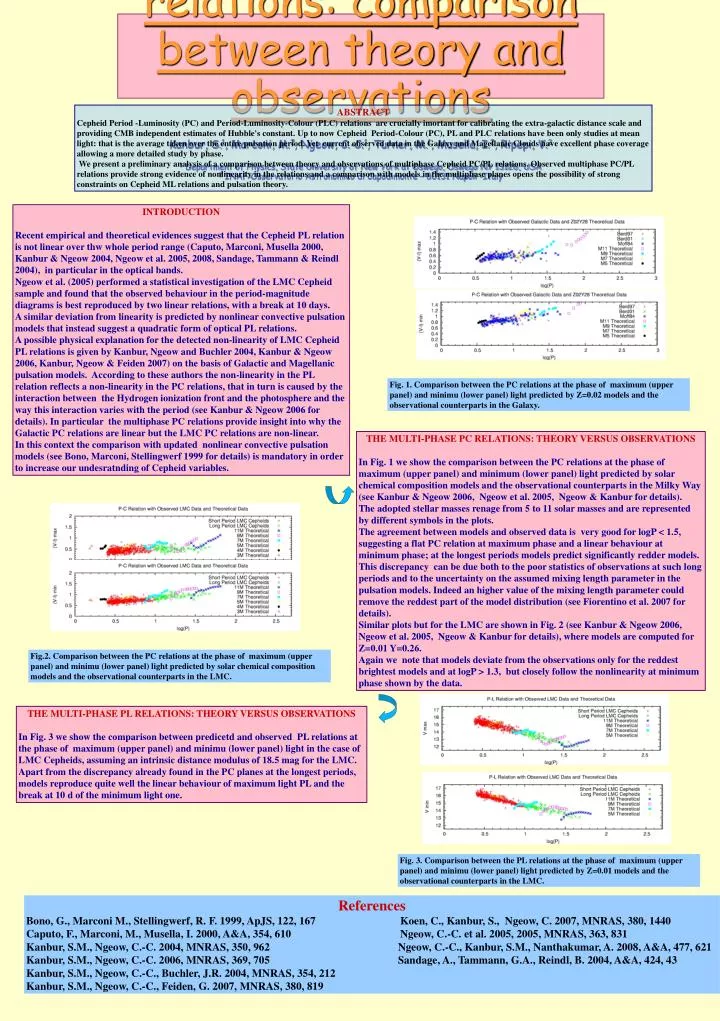
Fig.2. Comparison between the PC relations at the phase of maximum (upper panel) and minimu (lower panel) light predicted by solar chemical composition models and the observational counterparts in the LMC.

E N D
Fig.2. Comparison between the PC relations at the phase of maximum (upper panel) and minimu (lower panel) light predicted by solar chemical composition models and the observational counterparts in the LMC. Fig. 1. Comparison between the PC relations at the phase of maximum (upper panel) and minimu (lower panel) light predicted by Z=0.02 models and the observational counterparts in the Galaxy. Fig. 3. Comparison between the PL relations at the phase of maximum (upper panel) and minimu (lower panel) light predicted by Z=0.01 models and the observational counterparts in the LMC. ABSTRACT Cepheid Period -Luminosity (PC) and Period-Luminosity-Colour (PLC) relations are crucially imortant for calibrating the extra-galactic distance scale and providing CMB independent estimates of Hubble's constant. Up to now Cepheid Period-Colour (PC), PL and PLC relations have been only studies at mean light: that is the average taken over the entire pulsation period. Yet current observed data in the Galaxy and Magellanic Clouds have excellent phase coverage allowing a more detailed study by phase. We present a preliminary analysis of a comparison between theory and observations of multiphase Cepheid PC/PL relations. Observed multiphase PC/PL relations provide strong evidence of nonlinearity in the relations and a comparison with models in the multiphase planes opens the possibility of strong constraints on Cepheid ML relations and pulsation theory. INTRODUCTION Recent empirical and theoretical evidences suggest that the Cepheid PL relation is not linear over thw whole period range (Caputo, Marconi, Musella 2000, Kanbur & Ngeow 2004, Ngeow et al. 2005, 2008, Sandage, Tammann & Reindl 2004), in particular in the optical bands. Ngeow et al. (2005) performed a statistical investigation of the LMC Cepheid sample and found that the observed behaviour in the period-magnitude diagrams is best reproduced by two linear relations, with a break at 10 days. A similar deviation from linearity is predicted by nonlinear convective pulsation models that instead suggest a quadratic form of optical PL relations. A possible physical explanation for the detected non-linearity of LMC Cepheid PL relations is given by Kanbur, Ngeow and Buchler 2004, Kanbur & Ngeow 2006, Kanbur, Ngeow & Feiden 2007) on the basis of Galactic and Magellanic pulsation models. According to these authors the non-linearity in the PL relation reflects a non-linearity in the PC relations, that in turn is caused by the interaction between the Hydrogen ionization front and the photosphere and the way this interaction varies with the period (see Kanbur & Ngeow 2006 for details). In particular the multiphase PC relations provide insight into why the Galactic PC relations are linear but the LMC PC relations are non-linear. In this context the comparison with updated nonlinear convective pulsation models (see Bono, Marconi, Stellingwerf 1999 for details) is mandatory in order to increase our undesratnding of Cepheid variables. Multiphase PC/PL relations: comparison between theory and observationsKanbur, S.1, Marconi, M.2, Ngeow, C.-C.1, Turner, M.1, Musella, I.2, Ripepi, V.21 Department of Physics, State University of New York at Oswego, Oswego NY 13126, USA2 INAF-Osservatorio Astronomico di Capodimonte – 80131 Napoli -Italy THE MULTI-PHASE PC RELATIONS: THEORY VERSUS OBSERVATIONS In Fig. 1 we show the comparison between the PC relations at the phase of maximum (upper panel) and minimum (lower panel) light predicted by solar chemical composition models and the observational counterparts in the Milky Way (see Kanbur & Ngeow 2006, Ngeow et al. 2005, Ngeow & Kanbur for details). The adopted stellar masses renage from 5 to 11 solar masses and are represented by different symbols in the plots. The agreement between models and observed data is very good for logP < 1.5, suggesting a flat PC relation at maximum phase and a linear behaviour at minimum phase; at the longest periods models predict significantly redder models. This discrepancy can be due both to the poor statistics of observations at such long periods and to the uncertainty on the assumed mixing length parameter in the pulsation models. Indeed an higher value of the mixing length parameter could remove the reddest part of the model distribution (see Fiorentino et al. 2007 for details). Similar plots but for the LMC are shown in Fig. 2 (see Kanbur & Ngeow 2006, Ngeow et al. 2005, Ngeow & Kanbur for details), where models are computed for Z=0.01 Y=0.26. Again we note that models deviate from the observations only for the reddest brightest models and at logP > 1.3, but closely follow the nonlinearity at minimum phase shown by the data. THE MULTI-PHASE PL RELATIONS: THEORY VERSUS OBSERVATIONS In Fig. 3 we show the comparison between predicetd and observed PL relations at the phase of maximum (upper panel) and minimu (lower panel) light in the case of LMC Cepheids, assuming an intrinsic distance modulus of 18.5 mag for the LMC. Apart from the discrepancy already found in the PC planes at the longest periods, models reproduce quite well the linear behaviour of maximum light PL and the break at 10 d of the minimum light one. References Bono, G., Marconi M., Stellingwerf, R. F. 1999, ApJS, 122, 167 Koen, C., Kanbur, S., Ngeow, C. 2007, MNRAS, 380, 1440 Caputo, F., Marconi, M., Musella, I. 2000, A&A, 354, 610 Ngeow, C.-C. et al. 2005, 2005, MNRAS, 363, 831 Kanbur, S.M., Ngeow, C.-C. 2004, MNRAS, 350, 962 Ngeow, C.-C., Kanbur, S.M., Nanthakumar, A. 2008, A&A, 477, 621 Kanbur, S.M., Ngeow, C.-C. 2006, MNRAS, 369, 705 Sandage, A., Tammann, G.A., Reindl, B. 2004, A&A, 424, 43 Kanbur, S.M., Ngeow, C.-C., Buchler, J.R. 2004, MNRAS, 354, 212 Kanbur, S.M., Ngeow, C.-C., Feiden, G. 2007, MNRAS, 380, 819