Download
1 / 20
200 likes | 359 Views
Model Simulation of tropospheric BrO. Xin Yang , J. Pyle and R. Cox Center for Atmospheric Science University of Cambridge 7-9 Oct. 2007. Frascati, Italy. Basic model information.

E N D
Model Simulation of tropospheric BrO Xin Yang, J. Pyle and R. Cox Center for Atmospheric Science University of Cambridge 7-9 Oct. 2007. Frascati, Italy
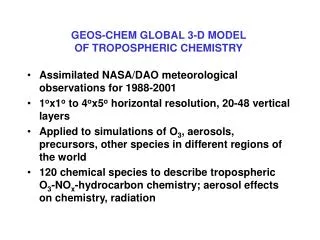
Basic model information • Model: a 3D global chemical transport model, p-TOMCAT, with detailed bromine chemistry [Yang et al., JGR, 2005]. • Br sources: 6 bromocarbons and sea salt from both open ocean and polar sea ice surface due to wind-driven production. A new size-dependent Br depletion factor for sea salt aerosols • Br-Chemistry: adding 3 heterogeneous reactivations on aerosols, such as HBr+HOBr—Br2+H2O • Forcing field: ECWMF reanalysis data (every 6hrs) • Resolutions: T42 (2.8x2.8 degrees) x 31 vertical layers • Simulation period: 1998 • Output frequency: 2hrs (to match GOME SZA for BrO)
BrONO2 HNO3 NO2 hv Cloud particles hv Br BrO HOBr HO2,RO2 BrO O3 hv hv NO, OH, RO2, BrO hv Sea salt aerosols ~0.62 TgBr/yr Br2 CH3Br, CHBr3, CH2Br2, CH2BrCl, CHBr2Cl, CHBrCl2 hv, OH OH hv HO2, RO2, HCHO, RCHO HBr Br HBr, HOBr, Br2 OH NO2 hv BrNO2 N2O5 wet or dry deposition Ocean sea salt Ocean, land, polar sea ice ~1-2 TgBr/yr Sea ice sea salt Bromine chemical scheme in p-TOMCAT model
Comparison with GOME in March The upper figure is the simulated monthly mean (March) daytime (9am-3pm) tropospheric column BrO(×1013 molecules/cm2 ). The bottom figure is GOME BrO – trop+strat Basically, the model captured the main feature of the GOME BrO in arctic with large level along Arctic coasts and over northern American (Good). An exception is over Greenland sea where model see a big BrO but GOME did not (Good or bad?) Satellite is less sensitive over open water? In SH, its autumn tropospheric BrO is about 2 ×10¹³ molecules/cm2, about 2 times of NH autumn level (Good) In the tropics, the lowest tropospheric BrO is 0.5 ×10¹³ molecules/cm2
Comparison with GOME in Sep. • Basically, the model captured the main structure of the ring-like high BrO around Antarctic during SH spring. Good • The simulated BrO in SH spring is higher than that in the NH spring. (Bad ?) • If model problem: • 1) overestimated Br depletion factor for seasalts • 2) not including humidity effect on sea salt production • If true: underestimated by satellite due to less ice cover in Southern Ocean • In NH, its autumn tropospheric BrO is about 1 ×10¹³ molecules/cm2, which is only half of SH autumn level (Good).
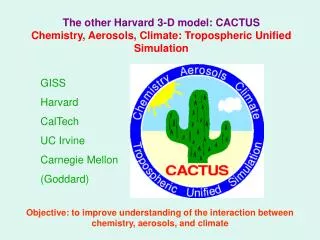
1998 Comparison between ground-based UV-vis and modeled tropospheric and stratospheric BrO columns. By Hendrick et al., ACP-2007-0224.
Satellite can not see BrO explosions happened in early spring in the SH (?!) This is consistent with ship measurement by Wagner et al., ACP, 2007
Zonal mean BrO (pptv) O3 loss (%)
Possible further collaboration We hope to work together with scientist in this fields to validate our model through more comparisons with derived-BrO data from both satellite and ground based measurements. These comparisons can be in short time scale, such as daily variation, or in long time scale, such as seasonal or year-to-year variation, even in long term trend. We hope TEMIS to supply more satellite column BrO data on global scale for further comparison, especially over the sites where high BrO events frequently happen, such as coastal regions of Arctic, Hudson bay, in SH over Weddle Sea and Rose Sea. We also hope observers to pay some attentions on the ‘potential high BrO plumes’ over regions where are open water in local spring. For example, over Greenland Sea and off the main ice sheet in the Southern Ocean.
Thanks Invitation by TEMIS/SEA EU project THALOZ NCAS/NERC, UK