Download
1 / 36
360 likes | 485 Views
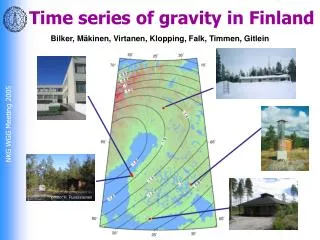
Homogamy and social structure over time in Finland. Jani Erola and Paul Lambert Social Stratification Research Seminar, Utrecht, 8-10 September 2010 . Aims . Construct CAMSIS scales for Finland Test the effects of homogamy on partnership matching with the scaling approarch.

E N D
Homogamy and social structure over time in Finland Jani Erola and Paul Lambert Social Stratification Research Seminar, Utrecht, 8-10 September 2010
Aims • Construct CAMSIS scales for Finland • Test the effects of homogamy on partnership matching with the scaling approarch
CAMSIS scale for Finland • Model the social distance between occupational units using average patterns of social interaction/ cohabitation between incumbents of occupations • www.camsis.stir.ac.uk • Correspondence analysis for large numbers of units using Stata macro; RC2 association models in R (gnm) for smaller numbers of units for standard errors • Interpret the social distance dimension as indicating the structure of social stratification (the reproduction of social inequality)
Census data inputs • Cohabiting couples, current or previous occupation • Job coded into 4 digit ISCO • Plus 2 category employment status • 5 yearly and pooled data
Could ignore this data (noise/inconvenience) • We choose to use it for groups 6-9 only
Occupational units • Occupations were recoded to finest level of detail available (in ISCO-by-employment status location) according to a rule of thumb that at least 30 cases must represent the occupation • Pre-defined recoding rules (use ISCO sub-groups)
Scale derivations using algorithms Algorithms proceed by: • Define any cohabiting combinations to be excluded from models (ISCO diagonals and farming related pseudo-diagonals – 1311; 6***; 9211) • Recode occupations to avoid sparsity for the remaining cases • Perform CA and extract dimension scores • Standardise scores to mean 50, sd 15 • Distribute dimension scores from analytical categories to all ISCO categories according to recoding algorithm
Some further illustrative examples • The role of detailed occupational differences • Illustrative male and female scale values • The problem of farmers
Males: Combined scale (1970-2005) Male and female CAMSIS scale scores for those ISCO units with over 4000 males in each ISCO
Females: Combined scale (1970-2005) Male and female CAMSIS scale scores for those ISCO units with over 4000 females in each ISCO Note how men in female jobs often have higher averages: e.g. 9132 is a ‘average’ job in the male distribution, but is more than 1 SD below average in the female distribution.
i.e. The placement of farmers is influential to the correlation with other things, and is likely to change between scales/time
CAMSIS/ISEI micro comparisons • Education • Income quintiles • Erikson-Goldthorpe classes • Separately for men and women • Using male scales
Changes in homogamy • Argument: homogamy increasing in most societies • Kalmijn, 1998; Sweeney & Cancian, 2004; Schwarz & Mare, 2005; Blossfeld, 2009 • ”Natural” test with couple-data based stratification data • Change in scales = change in the way how couple relationships are stratified • Does changing homogamy play a role in this?
Loglinear RC-models • RC-coefficients for men and women, changing marginals, diagonal cells controlled • RC-estimates for men and women, allowing change in diagonals • RC-coefficients assuming no yearly change should be the same as the scale values from CA • The impact of the changes in homogamy should be observed as a change in RC coefficients between the models
Caveats • Previous results suggest increasing homogamy according to education => occupations different story? • 1-digit level simply too coarse? • Now all cohabs, restricting analyses to marriages?
Conclusions • Social interaction distance scales appear to measure stratification quite well on Finnish data • Differences between men and women • Main difference between years involves farmers • Homogamy trends don’t seem to matter • Work very much in beginning…