Download
1 / 19
220 likes | 244 Views
A high throughput cell culture platform for bioprocess optimization. Seth Rodgers, CTO Bioprocessors CPAC Rome March 20, 2007. Outline. The role of model systems in process understanding A scale-down model bioreactor and the data sets we get now

E N D
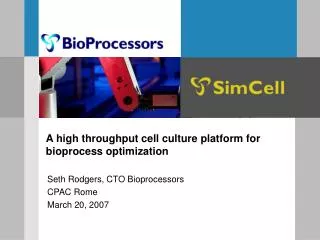
A high throughput cell culture platform for bioprocess optimization Seth Rodgers, CTO Bioprocessors CPAC Rome March 20, 2007
Outline • The role of model systems in process understanding • A scale-down model bioreactor and the data sets we get now • Challenges remaining – especially the data sets we’d like to get
Process Optimization** Scale Up Clone Evaluation Media Development* After discovery comes development, lots and lots of it! • Knowing gene for the protein you want is great, but what cell line to use? What clone form that cell line is best. 100s of possibilities! • 60 or more nutritional components in culture media, how many combinations? When to feed them? Inducers, promoters? • What temperature? What oxygen level? CO2? pH any shifts? When to harvest? • A strategy of multi-factorial design is the natural way to attack this type of problem, but is difficult to execute in cell culture because the parameters interact strongly-requiring a lot of experiments. This means models! Expression SystemDevelopment Flasks • Identify target, isolate gene, and develop expression system • Screen and select the highest producing and most stable clone • Develop optimal growth and production media for each cell line • Optimize conditions for biomanufacturing process in a “scale-down” version • Scale up process for use in large bioreactors for production of therapeutic Note : ** Represent iterative processes Source : Nature Biotechnology Vol. 22 (11) 2004
The role of model systems • Here, the data is the product, faithful representation of process equipment is the goal • Experiments with the systems that provide the best data, and the most understanding, i.e. production bioreactors themselves, are very time consuming and expensive. • Model systems are universally used, but represent a compromise: reduced time and expense in exchange for imperfect data, which leads to imperfect understanding • The same cost vs. data quality trade off that restricts experimentation in plant scale equipment often dictates the choice of model system Process understanding Real system: The API is the product Model systems: Data is the product
Can current models provide deeper process understanding? • I can compromise on quality to a point, but only so far. The data still has to tell us what we want to know • Are we at optimum? • Where to go next? • But we need to know NOW! • And we are going to need to know more soon! • QbD ideas of variance identification and reduction. • Statistical process control • Follow-on biologics • Particular challenge with animal cells. (long experiment times, sensitive to culture conditions) • A new model system could be very helpful 1000’s High Quality, High Quantity Well plate 100’s Throughput Experimental capacity per researcher 10’s Flask Bioreactor 1’s Low High Quality Ability to predict manufacturing bioreactor performance
SomeHigh-Throughput Cell Culture System Requirements • Deliver meaningful scalable data • Sustain cells, control temperature, O2, CO2, pH, agitation • Maintain sterility • Monitor cell density, pH, DO, metabolites, product titer • Operate with accuracy and precision and provide control of process parameters comparable to bench top bioreactor systems • Automatic operation with minimal operator supervision • Integration with tools for designing experiments and handling data
SimCell MicroBioreactor Array • 6 micro-bioreactors per array. • Working volume: ~700 µL. • Fluidic ports and channels for inoculation, feeds, pH adjustment and sampling. • Culture monitoring of biomass (OD), pH (immobilized sensors) and DO (immobilized sensors) by optical interrogation of micro-bioreactors. • Proprietary gas permeable materials result in kLa ~ 10 hr-1 for oxygen and ~ 25 hr-1 for CO2. • Experimental factors such as media composition, inoculation density, pH and feeds can be adjusted at the micro-bioreactor level. • But sensing through thin plastic windows can be a challenge!
SimCell Automated Management System • Incubators • One to five per system. • T, CO2, O2 and agitation control. • Sensing module • Total biomass by OD. • pH by immobilized sensors. • DO by immobilized sensors. • Sampling module • Sample removal to well plate. • Capable of dilution with single diluent (PBS). • Capable of volumetric dilution or dilution to specific cell density in well plate or MBR. • Dispensing module • One to eight pumps. • Real-time mixing at point of delivery. • Fluid sources may be swapped in between cycles for increased capacity.
SimCell™ On-Line Measurements: Cell Density • Measured using Optical Density at 633 nm on Sensor Station • OD is linear to 2.2 • Working OD range is extended by dynamic neutral density filtering • accurate measurements up to 50M cells/ml have been demonstrated • OD vs. cells/ml curve is specific to cell type • OD yields total intact cells: live + dead • Inteferences matter how to compensate for cell size? aggregation? • A better measurement might also tell us how many live and how many dead – dielectric spectroscopy? • Error bars are +/- 1 std. dev. (+/- 16% variance)
Measurements: Immobilized pH Sensors • pH Sensor Composition • Hydrogel (Water-swellable polymer) • Covalently bound dye fluorescent pyrene derivative. • Sensor manufactured by screen-printing, followed by UV polymerization • Response is independent of media • Precision is < 0.06 (±3 std. dev.) over • the pH range 6.0 – 8.0
SimCell On-Line Measurements: pH Measurement TechnologyImmobilized pH Sensor • Covalently bond fluorescent pH dye to hydrogel • Hydrogel polymerized to bottom surface of MBA • Retains ratiometric pH response Four sensors/chamber
Automated pH Control • Vadd: volume of solution of base to add • Vtotal: total volume of the sample in the microbioreactor before addition • PCO2: pressure of CO2 • kH: Henry’s Law constant for CO2 • [HCO3-]add: concentration of bicarbonate in the adjustment solution • pHinitial and pHfinal: starting pH value and pH setpoint, respectively • Similar equations are derived for use of sodium carbonate, sodium hydroxide, and monoprotic acids for pH adjustment.
Measurement and Control: Maintaining pH Setpoints • 3 pH setpoints • 18 subprotocols • 9 μBR/subprotocol • pH adjusted 2x/day • Chart shows average pH for each subprotocol over the course of the experiment.
φ SimCell™ On-Line Measurements: Dissolved Oxygen (DO) Measurement • Oxygen-sensitive dye (platinum porphyrin derivative) • Excitation of dye yields emissive triplet state. • As [O2] increases, dye emission is quenched and τF decreases • τF is correlated to phase shift (φ) between modulated excitation and emission signals Phase shift between excitation (blue) and emission (red) signals. Correlation of φ to DO: error bars are +/- 1SD (+/- 10% variance).
Novo’s Comparison with Current Technologies • Summary • 84% increase in yield • Scalable to 1,000 liter production vessels Significant improvement n process yield at lower cost and shorter time
Application across platforms and processes • The central question is “To what extent is the MBA performance a predictor of the bioreactor result?” • The R^2 statistic is a well-established way to quantify the answer to this question, computed by constructing ordered pairs of MBA and reference model system results • Advantages of R^2 are that is can be constructed independent of platform, process cell line, etc. • Compare relative predictive power across model systems: flask, MBA, bioreactor, well plate, etc. • Metric of continuous improvement as technology evolves • This graphic shows results over many cell lines, processes and vessels, predictive power might be even better for data with these factors kept constant R2 for 2006 client evaluation projects R2=0.96
What’s missing • Protein titer of course! • Enzymatic like ELISA is the most common, but it takes work, even with automation • Something else? • Viability • Some understanding of the protein quality (glycosylation, aggregation) • All those media components in the culture broth • Nutrients: glucose, glutamine, amino acids, vitamins • Metabolic products: lactate, etc. • Can spectroscopy (NIR, MIR, Raman work here?) • Anything else useful in characterizing and ‘fingerprinting’ the process, that is, a useful predictor of process outcomes. • Ideal measurement (for us at least) is • Non invasive – it it needs a sample, best case is • Small sample • Works with crude broth, no pre- treatment • Matched throughput • Calibrated less frequently than once per MBA • Compatible with flexible! plastic cell culture device (challenge for some spectroscopy) • Cost competitive pulling samples and using well plates
Conclusions • Model systems are indispensable tools, and increasing demands for data will be difficult to meet with current platforms. • A high-throughput cell culture system presents a possible solution if the data is of sufficient quality to predict process outcomes. • BioProcessors SimCell system represents one possible solution that combines high throughput with highly representative data.