Download
1 / 15
150 likes | 263 Views
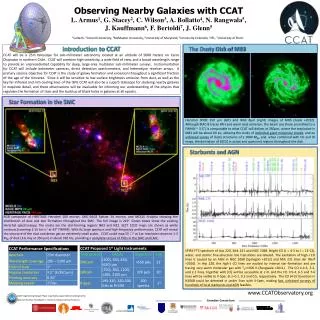
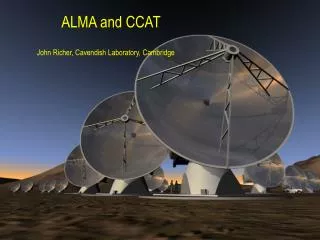
Direction-detection spectrometer concepts the CCAT. Matt Bradford + others 24 October 2006, in progress. 850 micron counts (stolen from A. Benson talk). Recall: modified IMF and star formation timescale included to reproduce 850 micron counts.

E N D
Direction-detection spectrometer concepts the CCAT Matt Bradford + others 24 October 2006, in progress
850 micron counts (stolen from A. Benson talk) Recall: modified IMF and star formation timescale included to reproduce 850 micron counts Matt Bradford
Models provide approach to CCAT population z distribution: Apply to C+ 350 um window 13% of sources 350 & 450 microns window are likely to access 31% of the 850 micron population in C+ 450 um window: 21% of sources Redshift Distribution from GALFORM model -- similar to Chapman
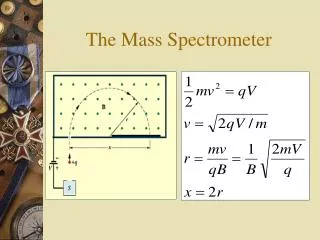
C+ 158 microns redshifted for CCAT spectrograph Recall: a 1 mJy 850 micron source is a ULIRG, independent of redshift CCAT spectroscopic sensitivities: 5 sig, 1h W/m2: 1.8e-19 (350) 1.2e-19 (450)
Options for far-IR through mm spectrometers • Grating spectrometer is the best choice for point sources • 1st order octave of instantaneous bandwidth • Good efficiency • But only moderate resolution • Fabry-Perot naturally accommodates spectral mapping • But scanning time results in sensitivity penalty, esp for searching • Fourier transform spectrometer (FTS) couples the full band to a single detector • Sensitivity penalty • Heterodyne receivers provide the highest spectral resolution • But suffer from quantum noise NEPQN ~ hn [dn]1/2 vs. NEPBG ~ hn [n (n+1) dn]1/2 • Also offer limited bandwidth: • 10 GHz IF bandwidth at 1 THz gives n / Dn ~ 100 Matt Bradford
C+ 158 microns redshifted for CCAT spectrograph Based on 1 hour sensitivities 1 mJy population is likely to be candidates for spectroscopy Source densities: 1 mJy (850) source densities: 1.2e4 per square degree -> means one per 65-100 (@ 450,350) CCAT beams Wideband spectroscopic follow-up
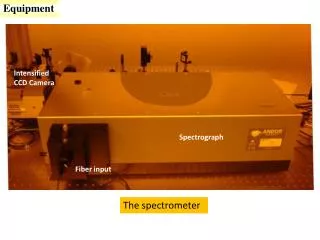
Examples of submillimeter-wave broadband systems: ZEUS for the JCMT / APEX Entrance slit Grating BP Filter Wheel M4 LP Filter 2 Detector Array M6 M5: Primary M2 M3 LP Filter 1 4He Cold Finger Entrance Beam f/12 3He Dual Stage Refrigerator Scatter Filter M1 4He Cryostat Cornell -- Stacey et al. 350, 450 mm windows w/ R~1000-1500 Matt Bradford
A new R~1000 echelle spectrometer for CCATAMULE -- Atacama MUltiband Longslit Echelle Design: Grating 816 micron pitch Assuming 128 spectral element array -- e.g. 0.86 mm pixels -- f/2.5 spectrometer, slightly oversampled Angular deviation off the grating 18 deg total. collimator must be oversized by 12 cm ! --> 30 cm diameter collimator --> grating 30 cm by 40 cm, to accommodate spatial throughput Matt Bradford
AMULE is large • So grating and collimator large fraction of 1 meter in all dimensions -- 1.5-2 times larger than ZEUS • Reimaging optics size will depend on the size of the slit, but also grows relative to ZEUS: • --scales as telescope f# x #of beams: Relative to ZEUS, AMULE will have 8/12 x 128/32 = 2.7 times larger reimaging optics. • Requires 35 cm (+ overhead) window if reimaged from telescope focus inside cryostat (but can be shaped like a slit) • Optics envelope inside cryostat approaching 1 meter in all dimensions. • Large but doable. 40 cm 30 cm 35 cm Matt Bradford
How about an imaging Fabry-Perot(BIG Imaging Fabry-Perot Interferometer (BIFI)) SPIFI demonstrates concept, at JCMT & the South Pole 5x5 spatial array, two scanning FPs provide R up to 10,000 at 200-500 microns 60 mK ADR-cooled focal plane Matt Bradford
ALMA Primary beam at 810 GHz And Herschel under-resolves it Herschel beam at 810 GHz 16x16 array on CCAT ALMA will resolve out extended emission in nearby galaxies CO 3-2 M. Dumke et al. 2001, CO 7-6 Bradford et al. 2003, Matt Bradford
How about an imaging Fabry-Perot(BIG Imaging Fabry-Perot Interferometer (BIFI)) BIFI will be much larger than SPIFI due to the large throughput Limitation is beam divergence in the high-res FP. Dcol ~ 1.5 l (R x nbeams)1/2 3 min x 3 min field Field size (1-D) driven by 20 cm beam Order-sorter also requires collimated 2.2cm (or slow) beam 1-D field size for 20 cm beam High-order FP spacing (mm) w/ F=60 Matt Bradford
BIFI will be much larger than SPIFI due to the huge throughput 8 x 20 cm = 160 cm collimator focus Faster final focal ratio (2-3) to accommodate large array Full field at f/8: 20 cm window! Array is as large as 10 cm Etalon spacing is modest: few cm even for 650 mm Collimated beam + overheads: 25 cm dia(and etalon must be near pupil) Factor of two in all dimensions of the optical train Matt Bradford
WaFIRS is an ideal broad-band point source architecture. -- possibility for multi-object spectroscopy Currently 4-5 cm delta z per module But could be smaller, far from limits: -- stiffness of plates -- detector illumination -- feed (f lambda from the telescope)
WaFIRS is an ideal broad-band point source architecture. -- possibility for multi-object spectroscopy 50 cm for > 10 modules