Download
1 / 32
320 likes | 328 Views
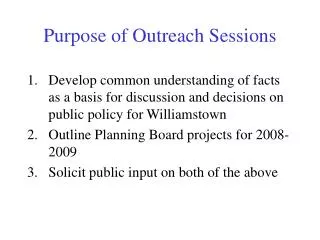
Purpose of Outreach Sessions. Develop common set of facts to be a basis for debates and decisions on growth and land use in Williamstown Outline Planning Board projects for 2008-2009 Solicit public input on both of the above. Town Budget Basics

E N D
Purpose of Outreach Sessions • Develop common set of facts to be a basis for debates and decisions on growth and land use in Williamstown • Outline Planning Board projects for 2008-2009 • Solicit public input on both of the above
Town Budget Basics • Budget is initially proposed as revenue limited, not expense driven. – Peter Fohlin • Yearly expectation is that total municipal expenditures will go up by about 3.5% - based in part on an annual increase in revenue from taxes on existing property that is close to Proposition 2 ½ limits, along with an annual property tax revenue boost from “new growth” • To illustrate, in recent years, the revenue from property taxes has been approaching $12M, increasing by around $475K per year. About $275K of that comes from what is allowed by Prop 2-1/2, and another $200K comes from tax revenue on “new growth” • To get that $200K boost from “new growth” requires around $15-19M of “new growth”, depending on tax rate
Are we big spenders? Measurement* Amount Rank Municipal spending/resident (2007) $2,466 150/351 State aid/resident (2007) $432 122/351 Avg. household property tax bill (2008) $4,635 86/3011 1 – In 1988 we ranked 20 places higher * Values do not count Williams students in population figures
As a fraction of household income, our average household property tax bill declined by 10% between 1990 and 1999 $1,799 $42,926 $2,826$75,366 Sources Average Household Income 1999: US Census Average Household Income 1990: Estimated from US Census household income distribution data Average Household Property Tax Bills: Massachusetts Department of Revenue (no median tax bill data available)
New Growth is the value of property added during a given year Source: Assessor’s new growth data and building permit data
Is new home construction important? • Tax revenue from land subdivision and new home construction, provides a ~$90,000 annual boost • Tax revenue from subdivision, plus home construction only on recently subdivided land, provides a ~$45,000 annual boost • The majority of ‘new growth’ revenue comes from non-expansive improvements
What inhibits new construction? • A review of the usual suspects: • Not enough developable land? • Too much regulation? • Limited demand for new housing?
Open Space – Numbers Total Williamstown acreage: 30,005 Protected Open Space: 11,6731 Upland Conservation District: 4,254 exclusive of the above2 15,927 acres, or 53% of land is formally or practically protected from development 1 - From MassGIS Open Space 2/08 data layer. This includes but is not limited to: Mount Greylock Reservation (3,518); Other State-Owned Land (2,730); Hopkins Forest (1,990); Conservation Commission (515); Rural Lands Foundation (454); Trustees of Reservations (430) 2 - The total area of the Upland Conservation District is 11,571 acres, but much of it overlaps with protected open space
With all that Open Space, is there any land left for people (and development)? • Williamstown ranks 116th out of 351 towns in the amount of non-protected land per-capita*: 2.2 acres * Williams College student population excluded Source: MassGIS OpenSpace datalayer, February 2008 (Hopkins Forest and Clark Art Institute were added to Williamstown measure)
Not to be confused with… Between 1997 and 2008, the fraction of the tax base enrolled in Chapter 61 increased from 3.0% to 4.9% Source: Assessor’s Chapter Land data
Open Space – Unfairly Suspect? • Sheltering land with Chapter 61 affects the tax base, but this is not protected open space • Chapter 61 enrollment is not permanent – can be reversed with no more than five years back tax payments • Additions to permanently protected space in past decade have been quite small • There is no local public policy that is driving land into permanent protection • Is the market finding the “highest and best use?” • The “opportunity cost” of recently added protected land is debatable • Our amount of developable land per-capita is significantly more than average • Cost of Community Services for protected Open Space in Williamstown is estimated at $0.28 per dollar in tax revenue from the same properties
Are regulations stifling growth? • You need to ask: In comparison to what? • Williamstown’s regulations and enforcement don’t seem to be unusual (with the possible exception of the Upland Conservation District) • And you have to define what you mean by “growth” • Lots of money has come into Williamstown • It hasn’t generally gone into new buildings though; mostly in driving up prices of – and financing improvements to – existing housing stock • One investigation* suggests that… • Regulations may inhibit subdivision of land • Found no evidence that they inhibit actual home building * Patrick Dunlavey, Presented to the Williamstown Planning Board, July 2008
New Homes, Second Homes Source: Williamstown assessor’s database, 2008
In terms of household income, Williamstown is relatively wealthy, and more like Massachusetts than Berkshire County Source: 2000 US Census P52
Households with school-age children have disproportionately high median income Source: 2000 US Census
Roughly one-in-ten home owners spends 30% or more of their income on housing Source: 2000 US Census H97
Population change1990 - 1999 Williamstown Massachusetts percent added/subtracted relative to aggregate 1990 population Source: US Census 1990 and 2000
School Enrollments 1989-2008 Source: Massachusetts Department of Education
Tax base: Residential vs. Commercial With 12.1% commercial property, Williamstown ranks 180th out of 313 towns - somewhat lower than the median but not remarkable Source: Massachusetts Department of Revenue 2008, 313 cities and towns compared
Residential & Commercial Valuation Relative to Total Valuation With 29.4% tax-exempt property, Williamstown ranks 3rd highest out of 313 towns Source: Massachusetts Department of Revenue 2008, 313 cities and towns compared
Conclusions • We have an aging and gentrifying population - largely coming from in-migration • Municipal and school services are declining • Most of us could easily afford higher property tax, but a significant minority cannot • Pursuing growth for short-term fiscal reasons may not be sound policy • Most of the “usual suspects” are not causes for fiscal dysfunction • Could tax-exempt property be the exception that proves the rule?
Planning Board Projects for 2008-2009 Review of Village Business District Current Village Business District (VBD) is comprised of two non-contiguous areas - one generally comprised of Spring Street, the other by upper Water Street Current purpose is to accommodate a broad mixture of uses in a compact pedestrian-oriented environment Master plan calls for promoting growth in downtown core Recent permitting for Spring Street project identified several obstacles to growth
Village Business District (cont) • Goal of VBD review is to see if acceptable development can be facilitated • Under consideration: • Review amount of set-back from residential uses • Adding special permit authority to increase building heights above 35 feet • Review requirement for on-sire stormwater recharge if storm sewer is available • Need for more off-street parking for Water and Spring • Possible linkage of VBD between Spring Street and Water Street
Planning Board Projects for 2008-2009 Low Impact Development Perennial problem of flooding – damage to homes and property, erosion, damage to water resources New developments may increase flooding if not planned properly Low Impact Development (LID) is an approach to stormwater management that relies on low-tech controls at the source Goal is to ensure that flood control after development is better than or equal to pre-development conditions
Low Impact Development (cont) Goal is to control stormwater at the source through small-scale management techniques, rather than just pipe all water to a low point and discharge. Key elements include the practice of reducing impervious cover, and using green space and natural areas to allow control of flow and to promote percolation Use of permeable pavements, rain gardens, grassed swales Part of effort is to reduce the building envelope to what is needed, so that other permeable areas allow for infiltration Less reliance on large structures like detention basins, catch basins and and pipes