Download
1 / 71
720 likes | 752 Views
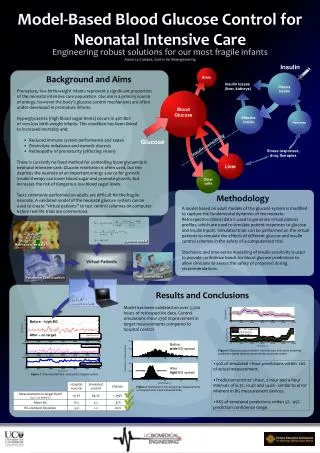
Real-time Monitoring, Control and Optimization of Patients Flow in Emergency Departments. Boaz Carmeli M.Sc. Thesis Exam Advisor: Prof. Avishai Mandelbaum The Faculty of Industrial Engineering and Management Technion - Israel Institute of Technology. Thesis Focus Areas.

E N D
Real-time Monitoring, Control and Optimization of Patients Flow in Emergency Departments Boaz Carmeli M.Sc. Thesis Exam Advisor: Prof. Avishai MandelbaumThe Faculty of Industrial Engineering and ManagementTechnion - Israel Institute of Technology
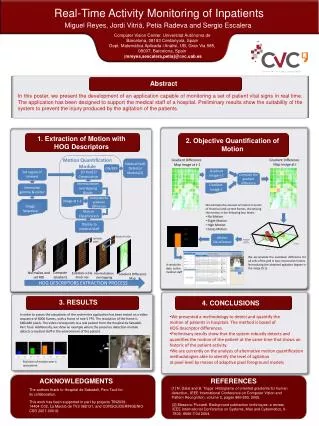
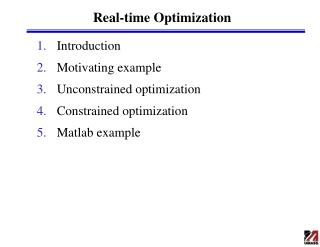
Thesis Focus Areas • Improving ED operations, focusing on real-time aspects: • Real-time monitoring • Real-time load measurement • Real-time patient-flow related decisions
Thesis Structure • Understand ED operations • End-to-end • Strategic, operational, real-time • Identify key performance indicators • Design a prototype ED real-time monitoring and control system • Based on event processing paradigm • Real-time and adaptive load monitoring
Thesis Structure - Continued • Understand real-time patient-flow within the ED • Which patient should physician treat next? • Follows ED manager insights and directives • Simulate ED patient flow • Simulated data - the ‘faculty’ ED simulator • Compare various patient-flow scheduling algorithms • Analyze a fluid model for the ‘which patient to treat next’ problem • Propose an optimal solution
Main Results • Propose an original approach for ED load monitoring • Together with Edward Vitkin • Formulate the ‘which patient to treat next?’ (PTN) problem • Cost vs. constraint approach • Cost functions • Propose multiple solutions for the PTN problem • Heuristic solution • Proactive computing • Analytic solution for stylized fluid-model • time-varying arrival rates • Analytic solution for steady-state heavy traffic • Contributed insights and problem understanding
Publications • Vitkin E., Carmeli B., Greenshpan O., Baras D., Marmor Y., MEDAL: Measuring of Emergency Departments Adaptive Load, MEDINFO 2010. • Huang, J., Carmeli, B., Mandelbaum, A., 2012. Control of Patient Flow in Emergency Departments, or Multiclass Queues with Deadlines and Feedback. In Preparation. • Carmeli B., Mandelbaum A., Promise: Real-time Patient Flow Monitoring and Control in Emergency Departments, The IEM 2010 Conference
Main Results – 1 (MIS) Monitoring and Measuring ED Load
Monitoring and Measuring ED Load • We defined a framework which provides a mean to monitor and measure load • The framework is based on Neural Networks paradigm which enables adaptive load definition • A NN learning mechanism adapts the load function towards specific ED setting and user (e.g., patient, physician) views
Main Results – 2 (MIS and OR) Heuristic Solution for the ‘Which patient to treat next?’ problem
Dynamic Control • At point of decision: • Check if any of the triage patients are just about to miss their deadline • If so – server triage patients • Else – perform a look ahead into the triage queues to check if all waiting patients can be served before their deadlines: • Assume you will serve the triage queues with all available capacity till all of them will be served • If look ahead check succeed • Serve the IP-patients • Otherwise • Serve the triage patients
Dynamic Control - Continued • If triage patients was chosen • Choose the one that is closest to the deadline (waiting-deadline) • If already beyond the deadline chose patient with highest fraction waiting/deadline • If in-process patients was chosen • Chose the one with the highest waiting cost • Using the provided cost functions
Main Results – 3 (OR) Optimal analytic solution for the stylized fluid model of the PTN problem
Fluid Model Analysis • We proved that a bang-bang control δ(•) defined over the set of time intervals T= {tsi, tei} and over the time-varying arrival rate function α(•) as follows: δ(t) = µ, tsi<t<tei ,δ(t) = α(t-d) otherwise.Where ‘µ’ is the maximal service rate and ‘d’ is the deadlineis optimal
Main Results – 4 (OR) Applying realistic cost function for resolving the in-process decision of the PTN problem
Cost Function • Cost for triage scores: • Age distribution of patients: • Expected ADT distribution:
Cost Function - Continued • Additional length of stay cost:
Cost Function – Graphs • Cost during the process (discharged only) • Polynomial increase while getting to the maximal accepted LoS
Real-time Monitoring, Control and Optimization of Patients Flow in Emergency Departments Boaz Carmeli M.Sc. Research Seminar Advisor: Prof. Avishai MandelbaumThe Faculty of Industrial Engineering and ManagementTechnion - Israel Institute of Technology
What you are about to see • The problem – monitoring and control of ED operations • Core IT concepts of ED monitoring and control system • Two interesting applications: • ED load monitoring and measurement • Just a very brief overview due to time constraints • Which patient to treat next? • Core ED patient flow control challenge
The Problem • The rising cost of healthcare services has been a subject of mounting importance and much discussion worldwide • Overcrowding in hospital Emergency Departments (ED) is perhaps the most urgent operational problem in the healthcare industry • Overcrowding in hospital EDs leads to excessive waiting times and repellent environments, which in turn cause: • Poor service quality (clinical, operational) • Unnecessary pain and anxiety for patients • Negative emotions (in patients and escorts) that sometimes lead to violence against staff • Increased risk of clinical deterioration • Ambulance diversion • Patients leaving without being seen (LWBS) • Inflated staff workload
Solution Approach • Improve ED operation efficiency through real-time monitoring and control • taking clinical, operational and service level aspects into account • (Sample) Key Performance Indicators: • Time Till First Encounter • Total Length of Stay • Bed Occupancy • ED Load • And many more… Adapt KPI to reflect new insights Define the key performance indicators (KPI) Monitor andmeasure theenvironment Analyze and interpret findings Control and Optimize Assess influence through monitor and measurement
Emergency Care • Seriously ill and injured patients from the community • Referral of patients with emergency conditions from other providers ED Conceptual Model Output: Admitted/Discharged Input: Arrivals Throughput: Under Treatment Ambulatorycaresystem Patient Arriveat ED AmbulanceDiversion Leaves withouttreatmentcomplete Triage and room placement • Unscheduled urgent care • Desire for immediate care • Lack of capacity for unscheduled care in the ambulatory care system Transfer to other facility Demand forED Care Patientdisposition Diagnostic evaluationand ED treatment Admit to hospital ED boarding of inpatients • Safety net care • Vulnerable populations (eg, Medicaid beneficiaries, the uninsured) care • Access barriers (eg, financial, transportation, insurance, lack of usual source of care)
Real-time ED Monitoring and Control System • Data Collection • Collect real-time relevant information from hospital IT systems such as PACS, EHR, ADT, LAB etc • Adding RFID based location tracking system for Physicians, Nurses, Patients and other relevant personnel • Data Visualization • Operational dashboard • Displays complex behaviors in a simple way • Mobile devices • Analysis Techniques • Mathematical models – service engineering • Simulations – for planning and control • Machine learning - neural networks, based on historical data • Published paper (MedInfo 2010): MEDAL: Measuring of Emergency Departments Adaptive LoadE. Vitkin, B. Carmeli, O. Greenshpan, D. Baras, Y. Marmor,
ED Simulator • Based on observation • Will be used, mainly, for design phase e.g. to mimic the RFID system • RFID based LocationTracking • Low level location tracking for patients and care personnel • Technology dependent capabilities • Hospital IT systems • Admit, Discharge, Transfer • Electronic Health Records • Lab request/results • Picture Archive and Communication System (PACS) System Architecture Data Collection Data Visualization Analysis Real Time Event Processing Network Rule Based Analysis Mathematical Modelse.g. Queuing Theory Machine LearningAlgorithmsAnalysis of HistoricalAnd Real-time Data
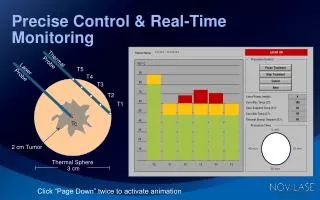
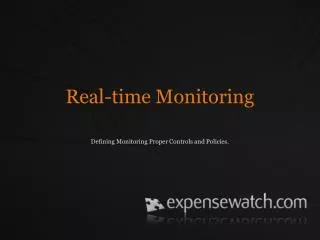
Real-time Monitoring Monitoring and Measuring ED Load
ED Load What is ED Load? • Number of people in ED? • Number of waiting people in ED? • Percent of time Doctor/Nurse works? • Combination of these? Clearly, there is no one simple answer. However, there are more questions, which can guide us toward the desired result: • What are the factors affecting Load? • How can we combine them? • Do we have to have same Load Definition for different EDs? • Do we have to have same Load Definition for different duties?
Monitoring and Measuring ED Load • We defined a framework which provide a mean to monitor and measure load • The framework is based on Neural Networks paradigm which enables adaptive load definition • A NN learning mechanism adapts the load function towards specific ED setting and user (e.g., patient, physician) views
Learning User Needs • Since user feeling of the system is not an explicit function we provide him tool for “easy” feedback: • INCREASE • increase • decrease • DECREASE
Real-time Control and Optimization Controlling and Optimizing the ED Patient Flow
The ED Patient Flow Administrative Reception Triage & Vital Signs First Physician Examination Treatment Imaging (CT, MRI, US) Consulting Lab Tests Physician Decisions or Additional Tests Admit/Discharge/Transfer administration
Controlling the ED Patient Flow • Modeling the ED patient flow as a queueing network • Patients – tasks • Care personal – servers (stations) • Knowing in real-time the next ‘station(s)’ in the patient’s route • Set of alternatives are usually provided by the care personnel • No a priory full path knowledge • System may provide decision support • Deciding upon the ‘best’ next station (e.g. next physician) • Assuming there are multiple options • Sends patient to the (clinically and operationally) ‘best’ station • Always make sure there is at least one ‘next’ station • Within each ‘station’ queue deciding upon the next patient to treat • Based on operational, clinical and patient fairness • service level aspects
Internal Queue Content New Arrivals Queues Content Triage Due Date Predicted Treatment Punishment 1 0 min T1 P1 2 10 min T2 P2 3 30 min T3 P3 4 60 min T4 P4 5 120 min T5 P5 Which Patient to Treat Next? (PTN) Patient under treatment at other ED ‘stations’ Triage Which patient should Doctor choose next? Doctor
Newly Arrived 3 Newly Arrived 1 InProcess 2 InProcess 4 InProcess 1 InProcess 3 Queueing Model for the PTN Problem Triage In Process patients Newly Arrived 2 physician
The ED Manager View • Reduce total length of stay at the ED while meeting triage deadlines • Try to keep total length of stay below 4 hours for all patients • Is this an appropriate goal? • Take service level aspect into account • Patient’s age • Precedence to old patients • Expected discharged/admitted aspect • Precedence to patients that are expected to be discharged to their home after treatment
Addressing the Clinical View • We suggest a service policy that seek to reduce the overall waiting cost while meeting triage deadlines • Minimal effort due-date policy • Allocate as much efforts as possible for IP-patients, following the known generalized cμ rule
Performance Indicators • Time Till First Encounter • Meet triage deadline • Total Length of Stay • 4 hours
Parameters of a Typical ED • Arrival Rates • Encounter Distribution • Which means that 30% of the offered load is handled during first encounters
Relevant Patient Parameters • Triage scores: • Age distribution of patients: • Expected ADT distribution:
Cost Function • Cost for triage scores: • Age distribution of patients: • Expected ADT distribution:
Cost Function - Continued • Additional length of stay cost:
Cost Function – Graphs • Cost during the process (discharged only) • Polynomial increase while getting to the maximal accepted LoS