Download
1 / 35
350 likes | 351 Views
This module explores the two major areas of statistics, descriptive and inferential statistics. It discusses important statistical measures such as central tendency (mean, median, mode) and dispersion (range, mean deviation, standard deviation). It also covers sampling distributions of mean and proportion.

E N D
S1 IDAC Research Methodology Module III Descriptive and Inferential Statistics
Descriptive and Inferential Statistics There are two major areas of statistics viz., descriptive statistics and inferential statistics. Descriptive statistics concern the development of certain indices from the raw data, whereas inferential statistics concern with the process of generalization. Inferential statistics are also known as sampling statistics and are mainly concerned with two major type of problems: (i) the estimation of population parameters, and (ii) the testing of statistical hypotheses
Descriptive and Inferential Statistics The important statistical measures that are used to summarise the survey/research data are: • measures of central tendency or statistical averages • measures of dispersion • Measures of asymmetry (skewness) • measures of relationship • other measures.
Measures of central tendency Amongst the measures of central tendency, the three most important ones are the arithmetic average or mean, median and mode. Geometric mean and harmonic mean are also sometimes used.
Mean Mean, also known as arithmetic average, is the most common measure of central tendency and may be defined as the value which we get by dividing the total of the values of various given items in a series by the total number of items.
Median Median is the value of the middle item of series when it is arranged in ascending or descending order of magnitude. It divides the series into two halves; in one half all items are less than median, whereas in the other half all items have values higher than median.
Mode Mode is the most commonly or frequently occurring value in a series. The mode in a distribution is that item around which there is maximum concentration. In general, mode is the size of the item which has the maximum frequency, but at items such an item may not be mode on account of the effect of the frequencies of the neighbouring items. Like median, mode is a positional average and is not affected by the values of extreme items. it is, therefore, useful in all situations where we want to eliminate the effect of extreme variations.
Geometric mean Geometric mean is also useful under certain conditions. It is defined as the nth root of the product of the values of n times in a given series. Symbolically, we can put it thus:
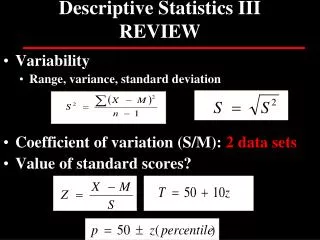
MEASURES OF DISPERSION An averages can represent a series only as best as a single figure can, but it certainly cannot reveal the entire story of any phenomenon under study. Specially it fails to give any idea about the scatter of the values of items of a variable in the series around the true value of average. In order to measure this scatter, statistical devices called measures of dispersion are calculated. Important measures of dispersion are (a) range, (b) mean deviation, and (c) standard deviation.
Range Range is the simplest possible measure of dispersion and is defined as the difference between the values of the extreme items of a series.
Mean deviation Mean deviation is the average of difference of the values of items from some average of the series. Such a difference is technically described as deviation. In calculating mean deviation we ignore the minus sign of deviations while taking their total for obtaining the mean deviation.
Standard deviation Standard deviation is most widely used measure of dispersion of a series and is commonly denoted by the symbol ‘ ’ (pronounced as sigma). Standard deviation is defined as the square-root of the average of squares of deviations, when such deviations for the values of individual items in a series are obtained from the arithmetic average.
SAMPLING DISTRIBUTIONS Some important sampling distributions, which are commonly used (1) sampling distribution of mean (2) sampling distribution of proportion (3) student’s ‘t’ distribution (4) F distribution (5) Chi-square distribution.
Sampling distribution of mean Sampling distribution of mean refers to the probability distribution of all the possible means of random samples of a given size that we take from a population. If samples are taken from a normal population, , the sampling distribution of mean would also be normal with mean and standard deviation = s p n , where m is the mean of the population, s p is the standard deviation of the population and n means the number of items in a sample.
Sampling distribution of mean But when sampling is from a population which is not normal (may be positively or negatively skewed), even then, as per the central limit theorem, the sampling distribution of mean tends quite closer to the normal distribution, provided the number of sample items is large.
Sampling distribution of proportion Like sampling distribution of mean, we can as well have a sampling distribution of proportion.
Chi- square distribution Chi- square distribution is encountered when we deal with collections of values that involve adding up squares. Variances of samples require us to add a collection of squared quantities and thus have distributions that are related to chi-square distribution. If we take each one of a collection of sample variances, divide them by the known population variance and multiply these quotients by (n – 1), where n means the number of items in the sample, we shall obtain a chi-square distribution. Thus, would have the same distribution as chi-square distribution with (n – 1) degrees of freedom.
WHAT IS A HYPOTHESIS Hypothesis is usually considered as the principal instrument in research. Its main function is to suggest new experiments and observations. In fact, many experiments are carried out with the deliberate object of testing hypotheses. Decision-makers often face situations wherein they are interested in testing hypotheses on the basis of available information and then take decisions on the basis of such testing.
WHAT IS A HYPOTHESIS Ordinarily, when one talks about hypothesis, one simply means a mere assumption or some supposition to be proved or disproved. But for a researcher hypothesis is a formal question that he intends to resolve. Thus a hypothesis may be defined as a proposition or a set of proposition set forth as an explanation for the occurrence of some specified group of phenomena either asserted merely as a provisional conjecture to guide some investigation or accepted as highly probable in the light of established facts. Quite often a research hypothesis is a predictive statement, capable of being tested by scientific methods, that relates an independent variable to some dependent variable.
Characteristics of hypothesis • Hypothesis should be clear and precise. • Hypothesis should be capable of being tested. • Hypothesis should state relationship between variables. • Hypothesis should be limited in scope and must be specific. • Hypothesis should be consistent with most known facts • Hypothesis should be amenable to testing within a reasonable time. • Hypothesis must explain the facts that gave rise to the need for explanation.
Null hypothesis and alternative hypothesis If we are to compare method A with method B about its superiority and if we proceed on the assumption that both methods are equally good, then this assumption is termed as the null hypothesis. As against this, we may think that the method A is superior or the method B is inferior, we are then stating what is termed as alternative hypothesis. The null hypothesis is generally symbolized as H0 and the alternative hypothesis as Ha.
PROCEDURE FOR HYPOTHESIS TESTING • Making a formal statement • Selecting a significance level • Deciding the distribution to use • Selecting a random sample and computing an appropriate value • Calculation of the probability • Comparing the probability